CHARTNOTES IMPROVEMENTSby Chip Anderson | ChartWatchers This weekend we've updated our ChartNotes chart annotation tool. On the surface everything looks the same, but for frequent ChartNotes users that are willing to remember a couple of new keyboard/mouse combinations, things should be much better. We've also thrown in some extra Fibonacci Lines for good measure.
Additional Fibonacci Levels
First, let's look at how to get those additional Fibonacci Lines onto a chart. Normally, ChartNotes will add lines at the 5 most common Fibonacci levels: 0%, 38.2%, 50%, 61,8% and 100%. The new version of ChartNotes allows you to add two addition Fibo levels: 23.6% and 161.8%. To get these additional levels to appear simply hold down the "Control" key on your keyboard before starting to draw your new Fibo Lines. That's all there is to it!
Perfect Circles and Squares
You can now create correctly sized circles and squares by holding down the "Shift" key while dragging the handles on any oval or box on your chart.
Filled/Hollow Ovals and Boxes
As before, if you press and hold the "Control" key and then drag out a new oval or box it will be filled with the selected color. What's new is that you can now also hold down "Control" and then click on the edges of an oval or box to toggle its filled/hollow status.
Instant Select
Another handy change lets you easily select any item even if your mouse isn't near the "Select" button. Now, holding the "Shift" key down instantly puts you into "Select" mode so that you can then click and select whatever is near your mouse.
Tab Key Selecting
Sometime several items are very close together making it hard to select the one you want with your mouse. Now you can use the Tab key to move the selection handles to any object on your chart.
"Ctrl-D" Duplication
Pressing "Ctrl-D" will instantly duplicate the currently selected Line, Box, Oval, or Arrow. The new item will appear just above and to the right of the original item.
"Ctrl-Drag" Duplication
The other way to duplication items is to hold down the "Control" key, move your mouse over the original item, and then click and drag the duplicate to it new position. This is great for quickly creating trendline channels.
We're continuing to work on improvements to ChartNotes. Feel free to use our Feedback page to let us know what you think of these changes and what other changes you'd like to see.
THE FED'S IN A BOX ... I've written recently about the Fed turning its attention away from the economy and back to inflation. Unfortunately, this week's market downturn is going to make its job a lot harder. The Fed apparently concluded that its easing program since last September would be enough to stabilize the stock market and the economy. This week's stock drubbing calls that analysis into question. How can the Fed raise rates to fight inflation with stocks tumbling? It can't. That should keep the dollar from rallying much further and could give a boost to gold. Money moving out of stocks and into bonds is also keeping long-term rates from moving up any further. Here's the problem. The market can't expect anymore help from the Fed. To lower rates again would give inflation another leg up which is a big part of the problem. Rising inflation and a weak economy make for stagflation which we haven't seen since the 1970s. One of our readers asked if "cash was trash" in an inflationary environment. Right now, cash looks better than stocks.
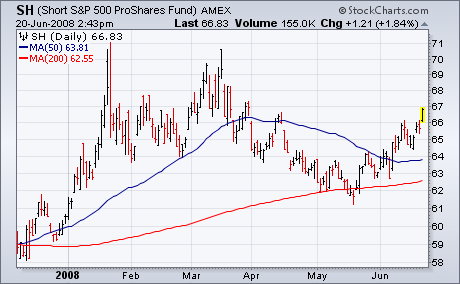
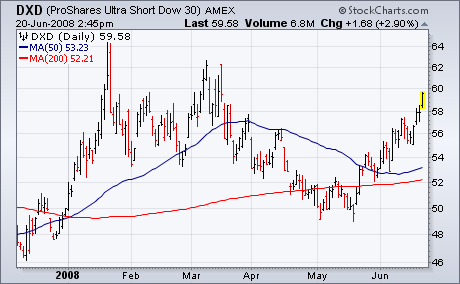
BEAR FUNDS ARE RISING ... Outside of bonds, the only other markets that gained ground today were bear funds. We've shown these two bear funds before, but here they are again. Chart 1 shows the Short S&P 500 ProShares Fund (SH) reaching a three-month high. Chart 2 shows the ProShares Ultra Short Dow 30 (DXD) acting even stronger.
A LITTLE DANDRUFF FOR IWMby Arthur Hill | Art's Charts
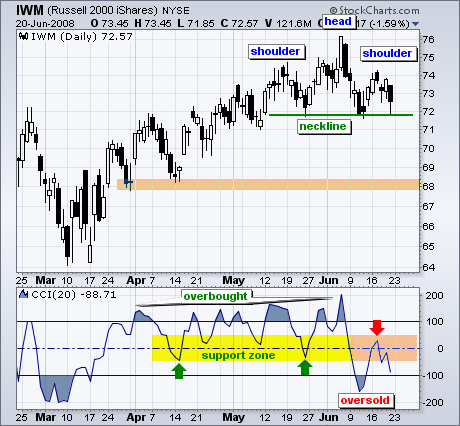
Despite a big decline in the S&P 500 ETF (SPY) over the last five weeks, the
Russell 2000 ETF (IWM) has been holding up pretty well. However, a bearish
reversal pattern and weakening momentum suggest that IWM will ultimately
follow its big brother lower.
On the price chart, IWM formed a small head-and-shoulders pattern over the
last six weeks. Neckline support resides just below 72 and a break below the
June low would confirm this pattern. Once confirmed, the initial downside
projection would be to around 68. The height of the pattern (roughly, 76 -
72) is subtracted from the neckline break for a target (72 - 4 = 68). There
is also support around 68 from the late March and mid April lows.
Signs of weakness are starting to appear in the Commodity Channel Index
(CCI). This indicator surged from oversold levels in early March to
overbought levels in early April. This surge started the bull run. Notice
that CCI never became oversold during the advance and dips below zero
provided nice buying opportunities (green arrows). CCI declined to oversold
levels in early June and this shows a reversal in momentum. Instead of
support and buying opportunities around the zero line, we can now expect
resistance and selling opportunities. Notice how CCI surged above zero, met
resistance and then declined this week (red arrow).
There is also a videoversion of the this analysis available at TDTrader.com - Click Here.
IT'S STILL A BEAR & THE OIL BUBBLEby Carl Swenlin | DecisionPoint.com Discussions about the price of oil are in the news every day, but my observation is that, for the most part, these discussions serve only to confuse the public more. Most popular are the conspiracy theories, blaming the high prices on shadowy behind-the-scenes manipulators. These theories have one purpose, which is to keep the public stirred up and in the dark. (Remember how mushrooms are grown.)
Most people don't understand the futures market at all. I am by no means an expert, but I have gleaned enough information recently that I think I can enlighten some of my readers. Futures markets exist primarily to serve the producers and consumers of commodities, who use futures contracts to hedge future prices of a given commodity. The producer wants to lock in a price that will ensure he covers his costs and makes a good profit. The consumer wants the same thing, and the object of both is to facilitate their business planning by having advance knowledge for what the price of the commodity will be when it is delivered in the future.
Those evil speculators, are actually necessary participants in the market who serve the purpose of market makers, and they take risks to do it.
While fundamentals play an important role in futures prices, human emotions are also a big part of the mix. Occasionally, like now, irrationality rules the day and a price bubble forms. The easiest way to tell that a bubble exists is to check the monthly-based chart for a parabolic formation. This is were prices move higher in an accelerating curve that eventually becomes vertical. On the chart below, you can see that this is the case with crude oil. This is a sure sign that prices are no longer connected to reality.
You will notice that just eighteen months ago oil was at $50/bbl. Now it is nearly three times that price. Have fundamentals changed so radically during that time? Of course not. The same kind of irrationally is at work in the oil market as we currently have in the housing bubble, and as we had in stocks in 2000.
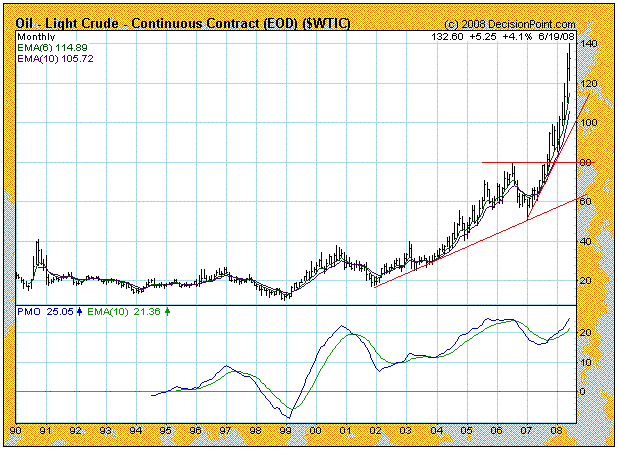
The expansion in the number of oil mutual funds and ETFs has also placed a lot of demand for oil futures contracts. While this has helped drive prices higher, remember, it is a two-way street. When the parabolic finally breaks, there will be a stampede for the exits.
I can't guess how high oil prices will go, but eventually there will be a catalyst of some sort, and prices will fall almost vertically, quickly bringing oil prices back in to the realm of reality. The most obvious catalyst would be if congress lifted the ban on domestic drilling. While that doesn't sound likely now, the rising price of gasoline may eventually turn the screws enough to change some minds.
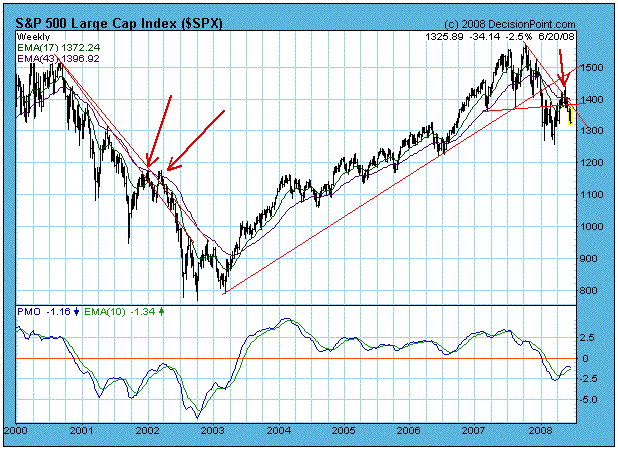
As for the stock market, the bear market clearly remains in effect. Our long-term sell signal has never wavered during the recent rally, but there were certainly plenty of plenty of positive signs (see my June 6 article) that suggested the bulls were about to take charge. One of the strongest signs was the price breakout above the declining tops line drawn from the bull market top. Obviously, this was a fakeout because prices failed to remain above support and are now headed for a retest of the March lows. Fakeout breakouts are common in bear markets -- I have identified two that occurred in 2001-2002.
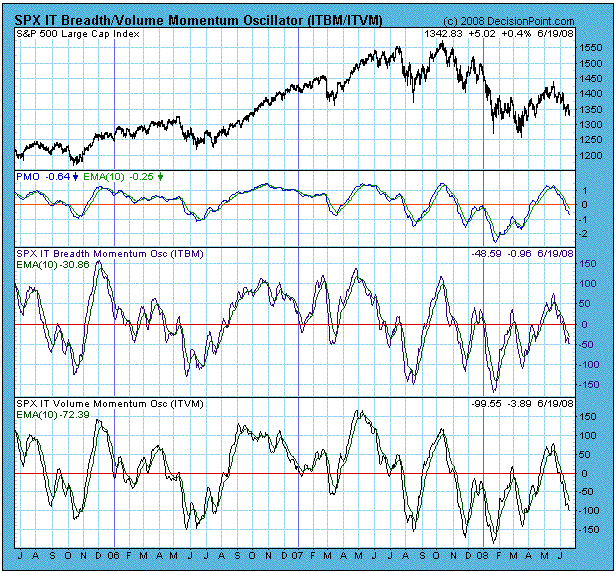
The next chart shows our primary intermediate-term price, breadth, and volume indicators, which we use to determine the condition of the market. All are becoming oversold, but not so much so that there isn't room for further price decline. And, remember, in a bear market oversold conditions can mark the threshold for further price declines.
Bottom Line: Current high oil prices cannot and will not be sustained. Bubbles eventually burst, destroying all the foolish logic that said that prices would never go down again. I personally believe that, if congress lifts the drilling ban, oil prices will drop by about 50% within a few months of that action.
The stock market's bullish breakout has failed and prices are headed for a retest of the March lows. Bear market rules apply!
FINANCIALS LENDING NO SUPPORTby Tom Bowley | InvestEd Central On May 19th, I discussed what appeared to be a topping market. Since that time, the Dow has lost 8.82%. The S&P 500 has lost 7.51%. The NASDAQ has lost 4.86%. The SOX has lost 9.24%. The XLF (an ETF that tracks financials) has lost 16.67%. The bank index has lost 22.32%. The XLY (an ETF that tracks consumer discretionary stocks) has lost 10.65%. These are ONE MONTH returns, folks. The number that really jumps out though is the 22% loss in the bank index in one month. While the major indices appear to be heading to test March lows, the bank index has already blown right through those lows - see the chart below.
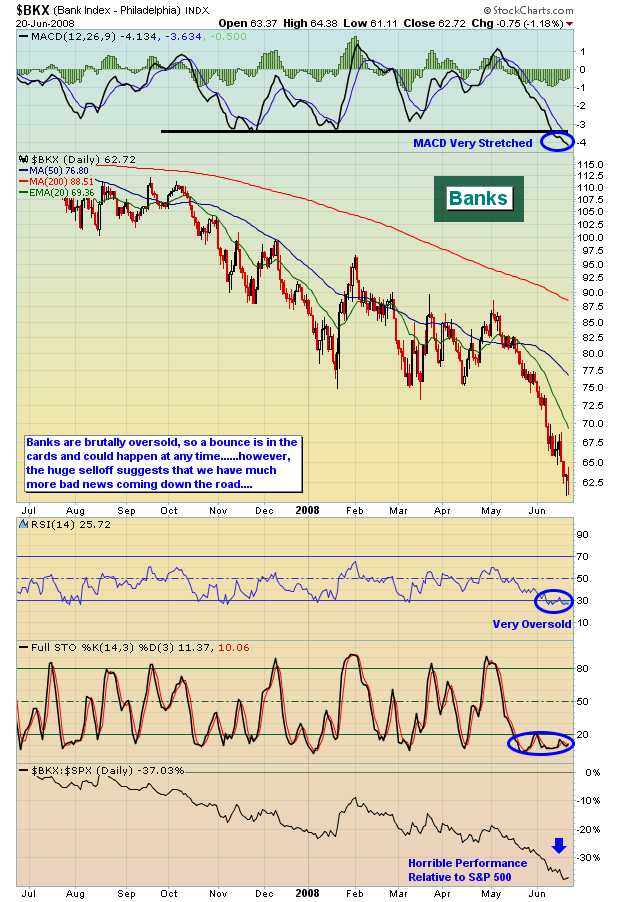
The technicals are suggesting that the news in coming months is only going to get worse, not better. Cutting dividends, raising capital and mounting losses are the three news items most closely associated with financials these days. Don't expect it to change anytime soon. Yes, the sector is very oversold so a bounce is quite likely in the near-term. However, shorts are likely to get aggressive again on any oversold bounce.
I don't believe we've seen a bottom in this downtrend yet. Negative sentiment is elevating, but we need extreme readings to mark a bottom. We have a Fed that has its hands tied, a struggling economy, and a teetering consumer. Lower equity prices will only exacerbate the problem. I maintain a positive outlook for equities over the long-term, but expect the short- to intermediate-term to be volatile at best. Take a look at the long-term chart of the NASDAQ to appreciate the possible short-term weakness in price while still remaining in its long-term uptrend.
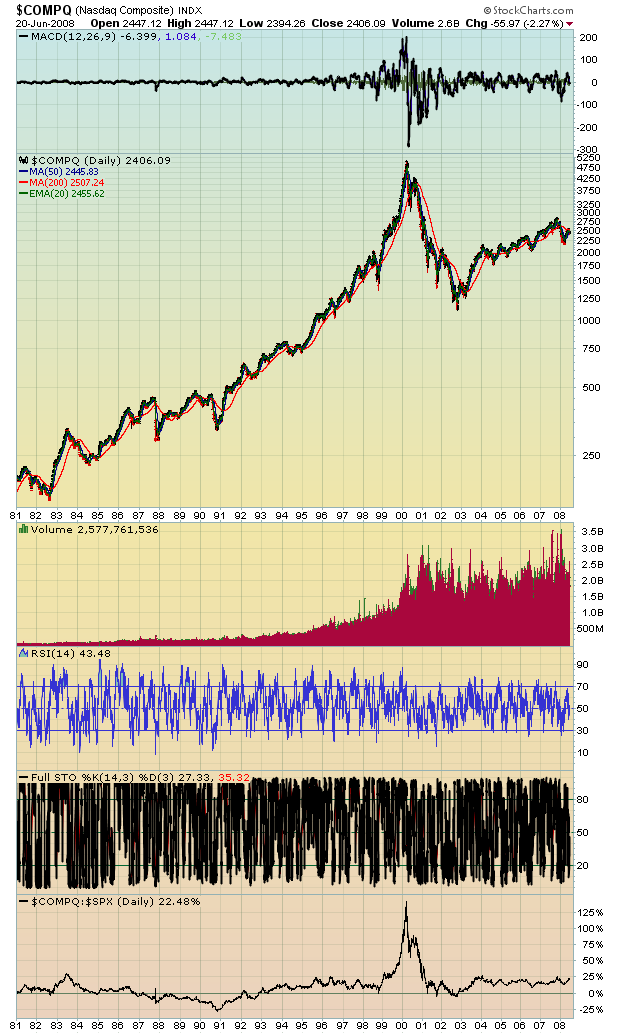
I would remain cautious near-term.
Happy trading!
Join Tom and the Invested Central team at www.investedcentral.com. Invested Central provides daily market guidance, intraday stock alerts, annotated stock setups, LIVE member chat sessions, and much, much more.
FOCUSING ON S&P ENERGY/FINANCIALSby Richard Rhodes | The Rhodes Report As the world stock markets have embarked on what arguably is another "leg lower"; we are left to wonder aloud what the relative rotation beneath the surface of this decline will look like in terms of tactical allocation. Our focus has been upon the S&P Energy / S&P Financials Ratio (XLE: XLF) as of late, for there is quite a bit of pent-up leverage extant in this chart as the world's hedge and mutual funds are very clearly very long energy and clearly very short financials. At some point, the leverage of reversing this position by being short energy and being long financials will produce enormous gains to one's portfolio. Clearly, it shall make one's trading year or perhaps even one's trading lifetime when it materializes. The question is one of "when" and not "if" in our minds.
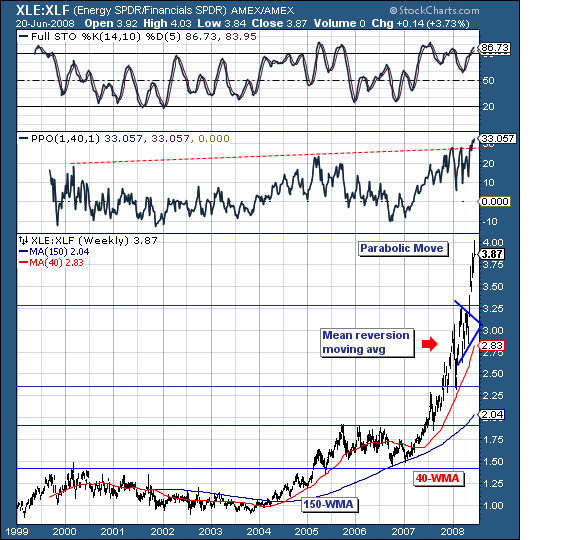
Taking a technical look at the ratio chart, it clearly illustrates the parabolic move began in earnest at the beginning of 2007 from the 1.50. Now, we all know that parabolic moves end badly and in a "trail of tears", with this one highly likely to do so as well. Currently, the ratio trades at 3.87, with a majority of this move occurring since the beginning of 2008. We're mean reversionists at TRR; hence we're looking for a mean reversion exercise towards the 40-week moving average given the ratio stands +33% above this level - a historical record indeed. Moreover, the stochastic indicator has moved back into overbought levels...that in the past have provided for a "top" once it turns lower. In other words, the balance of risks is pointed downward, which when combined with the absolute "love fest" shown energy stocks and absolute "disdain" accorded the financials...are the conditions such that can a reversal lower not be far off?
Good luck and good trading,
Richard Rhodes Capital
Advertisement:
