Hello Fellow ChartWatchers!
This week I wanted to tell you about a new feature we've just rolled out in our ChartNotes chart annotation tool. It is called "pinning" and it allows you to prevent any of your saved annotations from scrolling to the left over time.
Normally, you want your annotations to scroll to the left because that is what the price bars do. As the price bars move, you want your trendlines and arrows and other annotations to move with them. However, there are certain kinds of annotations that you might not want to move - particularly "High Level" text comments, i.e., comments that describe what the chart is showing, not a specific feature of the current chart. Consider the following example:

On this chart the blue trendline, the red arrow and the text comment about the trendline break are all directly associated with the price action and we want them to move left with the price bars over time. In other words, we want those annotations to be "unpinned" (which is how things have always worked).
The other annotations at the top of the chart are different. The text that describes the chart and the box that surrounds that text are not directly associated with the current price action and we don't want that text to move over time. To prevent that text from moving, we can now "pin" that text so that it stays put. Text, callout boxes, boxes and circles are now "pinnable" annotations.
To pin an annotation, first click on it with the Selection tool, then click on the blue "pin" icon that appears on the lower left side of the ChartNotes window (see the picture above). That's all there is to it!
Hopefully, you'll find many uses for pinned (and unpinned) annotations. Let us know if you find a particularly useful way to use this new capability.
.- Chip
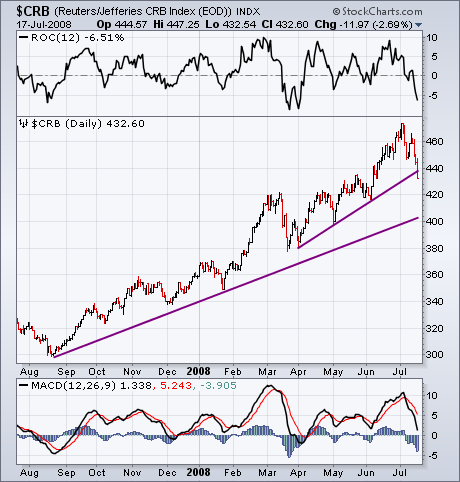
This week's downturn in crude oil prices has had a depressing effect on the entire commodity group. Chart 1 shows the CRB Index (plotted through Thursday) breaking a three-month up trendline (and its 50-day moving average). The 12-day Rate of Change (ROC) line (top of chart) has fallen to the lowest level in more than three months. And the daily MACD lines (bottom of chart) have turned negative after forming a "double top" between March and July. The minimum downside target is most likely a test of the 400 level which would test a yearlong support line and the early May low. I wouldn't, however, rule out a further drop to the March low at 380. The weekly CRB chart also suggests a very over-extended market in need of a correction.
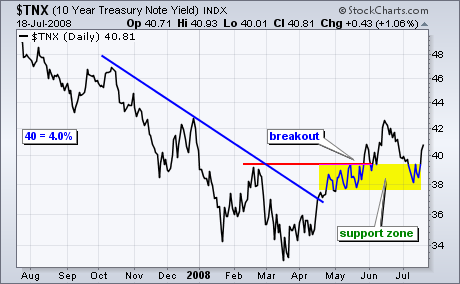
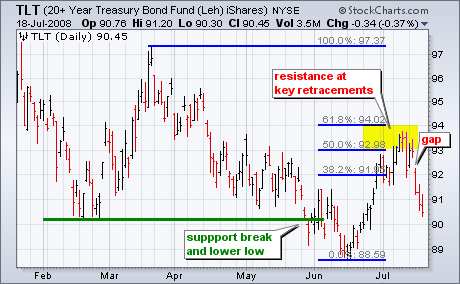
After the Producer Price Index (PPI) surged on Tuesday, it was little surprise to see big gains in the Consumer Price Index (CPI) on Wednesday. Bernanke warned of inflation in his congressional testimony last week and the PPI-CPI figures confirm. The CPI surged 5% year-on-year and 1.1% month-on-month. That 1.1% monthly gain translates into an annual rate much higher than 5%. The 5% year-on-year change was the highest since 1991, while the 1.1% month-on-month change was the highest since 1982. For the sake of argument, let's take the 5% year-on-year change as the annual inflation rate. The 10-Year Note Yield ($TNX) is currently around 4.08%, which means the real yield is actually negative (4.08% less 5% equals -.92%). A negative real yield is bad news for bonds. The first chart below shows the 10-Year Note Yield ($TNX) breaking resistance from its February highs with a surge above 4% (40). TNX pulled back over the last few weeks, but found support around 3.8% (38) and moved higher this week. The second chart shows the iShares 20+ Year Bond ETF (TLT) hitting resistance after retracing 50-62% of the March-June decline. The ETF gapped down on Wednesday as investors reacted to the news on inflation and the negative real yield.
There is also a videoversion of the this analysis available at TDTrader.com - Click Here.
In my July 3 article I warned that the market was oversold, dangerous, and vulnerable to a crash. On Tuesday of this week, the S&P 500 opened down, breaking significant support, and kept moving lower. I thought to myself, "This is it. Crash in progress." Then subtle buying began, the decline was stopped in its tracks, and an advance began that lasted three days. My sense of the events was that the Crash Prevention Team had acted, but that is pure speculation about an urban myth. Certainly there were fundamental events later in the week that assisted the rally -- the president's lifting the executive prohibition of off-shore drilling, and oil prices dropping to $130 -- but the price reversal during the first hour on Tuesday seemed magical to say the least.
At this point the advance has hit the overhead resistance of a declining tops line. If that is decisively penetrated, I would conclude that the rally will continue, although, there is another declining tops line dead ahead.
While the volume for the rally has been convincing, and medium-term indicators are very oversold, I am not so impressed with two key short-term indicators shown on the next chart. The Climactic Volume Indicator (CVI) and the UP Participation Index (PI) are where I look for evidence of an initiation climax, which would confirm that an advance is receiving broad participation from both volume and price. (An initiation climax demonstrates that the initial surge of the rally has sufficient internal strength to support and extend an apparent price reversal.) So far the CVI and PI levels are far short of the overbought levels needed to reflect that an initiation climax has occurred; although, this deficiency could be remedied next week. At any rate, I recommend keeping an eye on these indicators as (if) the rally continues.
Bottom Line: A crash was averted this week, and the potential for a new medium-term rally has developed. There are plenty of reasons to believe in this rally, but be advised that important short-term evidence has not yet materialized. If prices head back down for a retest, the danger meter will be redlined. If the rally does indeed continue, there will be wide-spread belief that the bear market is over. In my opinion, that conclusion will eventually be proved wrong. Participation in the rally, if it develops, should be managed on a short-term basis and on the assumption that it is only a bear market rally.
Tuesday afternoon marked a short-term bottom. In my opinion, we're going to print AT LEAST one more low in time; however, the sentiment had deteriorated on Tuesday to a point where we normally we see a rebound. In addition, there was TONS of net put premium (in-the-money put premium minus in-the-money call premium) and options were set to expire on Friday. We'll discuss sentiment issues shortly, but first take a look at the following closing prices on ETFs as of Tuesday and their respective max pain (the price point at which the premium on in-the-money call options equals the premium on in-the-money put options) prices:
DIA - closed on Tuesday at 109.30 and max pain was near 114.
SPY - closed on Tuesday at 120.99 and max pain was near 128.
QQQQ - closed on Tuesday at 44.24 and max pain was near 48.
XLF - closed on Tuesday at 17.17 and max pain was near 21.
I calculated the value of the net put premium on the QQQQ as of Tuesday and determined it to be approximately $250 million! That's just for one ETF. Imagine the amount of net put premium across all stock, ETF and index options. If the QQQQ's had continued to decline, the net put premium would have risen exponentially. In addition, there were over 1.825 million put option contracts traded on Tuesday, a record since the CBOE has been providing the equity only put call data. Simply put, the bears were a greedy bunch and the rubber band was stretched about as far as it was going to go near-term. As a result, there was a wicked rally on Wednesday and Thursday as prices gravitated much closer to max pain points. The max pain is a figure I calculate every month and it provides yet one more clue as to how the market might react near-term. This time, it was dead on.
Now back to sentiment. The equity put call ratio finished on Tuesday at .90 and the 5 day moving average of the equity only put call ratio had spiked to .88, the highest level since March 24th. In addition, the VIX spiked above 30. Readings above 30 on the VIX have coincided with recent market bottoms. In my last article, I discussed the lack of poor sentiment readings and indicated that we needed to see a step up in fear. We finally saw that on Tuesday. Now for the bad news. It wasn't fearful enough. The market was already primed to rebound off of oversold conditions, max pain issues and even a few recent positive divergences on intraday charts. That rebound materialized on Wednesday and Thursday. Take a look at Chart 1 below to review the VIX:
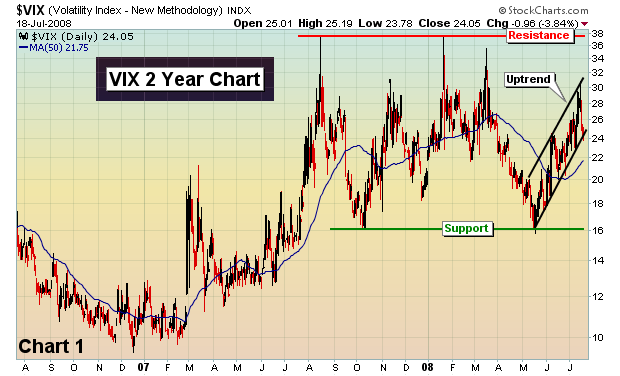
The resistance area on the VIX is above 35 - we have plenty of room to ramp up fear. The current uptrend may take us to that level before it breaks. Time will tell. Separately, while the put call ratio has been on the move to the upside and reflecting increased pessimism, it too has more room to go. Check out Chart 2:
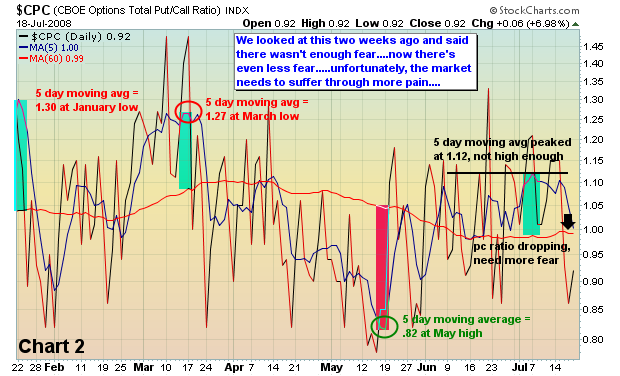
While we mentioned earlier that the "equity only" put call ratio approached the March fear levels, the total put call ratio as reflected in the above chart did not.
Historically, we entered on Friday the 2nd worst time period of the year. At Invested Central, we provide a historical perspective ("The Bowley Trend") on each trading day. For instance, consider the following data that relates to trading on the S&P 500 since 1950:
On July 18th, the S&P 500 has advanced 13 times, declined 29 times and has produced an annualized return of -46.48%
July 19th - 19 up days, 22 down days, -16.15%
July 20th - 19 up days, 23 down days, -20.76%
July 21st - 16 up days, 24 down days, -46.18%
July 22nd - 17 up days, 23 down days, -49.24%
July 23rd - 19 up days, 22 down days, -57.19%
Now for the NASDAQ since 1971:
July 18th - 9 up, 18 down, -91.68%
July 19th - 15 up, 13 down, -52.32%
July 20th - 14 up, 13 down, -17.81%
July 21st - 10 up, 16 down, -83.59%
July 22nd - 11 up, 14 down, -71.33%
July 23rd - 12 up, 13 down, -158.68%
July 24th - 12 up, 14 down, +1.49%
If the market advances over the next week, it will be doing it against significant historical headwinds.
Happy trading!
Join Tom and the Invested Central team at www.investedcentral.com. Invested Central provides daily market guidance, intraday stock alerts, annotated stock setups, LIVE member chat sessions, and much, much more.
Last week may very well have been an important turning point in the US stock market, with the Dow Industrials and the Russell 2000 Small Caps as forming bullish "key reversal" patterns to the upside. This would suggest an increased probability of further strength on the order of several weeks or perhaps even months; however, we would caution that the probability of such a rally isn't as high as it would be normally given the weak advance/decline figures as well as the up/down volume figures - hence we believe it will be nothing more than a countertrend rally apt to fail. We'd like to have seen stronger advance/decline figures to provide some clarity to these bullish formations, but they simply weren't sufficient for our liking.
Be that as it may, we want to bring collective attention to the Housing Index ($HGX), which did manage to form a bullish "key reversal" accompanied by high volume. This would further suggest a rally of some magnitude is forthcoming; but once again we'll not put as high a probability of it developing as we would have if the broader market had printed stronger advance/decline figures. In any case, we wouldn't be surprised to see mean reversion higher materialize towards the declining 50-week exponential moving average at 145.

Therefore, we would use any declines in either Ryland Homes (RYL) or Toll Bros. (TOL) to put on a long position. We chose those two given they have performed relatively better than the Housing Index, which clearly broke its January lows. RYL and TOL did not; and if we are going to be long, then we want to be long that which is showing relative strength. As for risk...one can risk a break of the recent lows.
Good luck and good trading,
Richard Rhodes


