USING KELTNER CHANNELSby Chip Anderson | ChartWatchers
Hello Fellow ChartWatchers!
Let's start the month of August off right with a good, old-fashioned education article about the modern version of a good, old-fashioned chart overlay, Keltner Channels! Here we go...
Keltner Channels are a set of three lines that are overlaid on top of the price bars of a chart. As with other channel overlays, the outer two lines define a region that generally "contains" the price action and helps you determine if the prices are "too high" or "too low" relative to a specified moving average. Here is an example:

In the chart above, the Keltner Channels are the thin blue lines above and below the candlesticks on the chart. The red line corresponds to the 20-day Exponential Moving Average that defines the center of the channel. Notice that the candles generally appear to "bounce" off the blue channel lines are return to the red central line.
History
The original version of Keltner Channels was described by Chester W. Keltner in his 1960 book How to Make Money in Commodities. Keltner called his channel concept the "Ten-Day Moving Average Trading Rule" and defined it as a pair of lines positioned above and below a 10-day simple moving average of the chart's "typical price" - i.e., ( high + low + close ) / 3. The distance between the channel lines and the central line was defined as the 10-day simple moving average of the chart's "range" - i.e., high - low.
This original version of Keltner Channels was relatively easy to calculate in the days before computers and worked pretty well for trading commodities. As time passed, other channel systems - such as Bollinger Bands - became more popular. In the 1980s, Linda Raschke introduced a newer version of Keltner Channels that was based on the Exponential Moving Average and the Average True Range (ATR) indicator. StockCharts.com uses this more modern version of Keltner Channels.
Formula
In the modern version of Keltner Channels, the central line is (typically) a 20-period Exponential Moving Average. The upper and lower bands are drawn at an equal distance from the central line. The distance is defined as a specified multiple (typically 2x) of the ATR(10) indicator.
In SharpCharts, the Keltner Channels take three parameters. The first one is the period of the central EMA. The second one is the multiplier for the bands. The last one is the period of the ATR indicator. The default parameter values are "20,2.0,10".
In the chart above, we've added the ATR(10) indicator below the price plot. You can see how the Keltner Channel expands as the ATR(10) value rises and contracts when it shrinks.
Note: Sometimes when using Keltner Channels on a log scale chart, the lower band will exceed the price scale and become cut off. To alleviate this, change the scale setting from "log" to "linear."
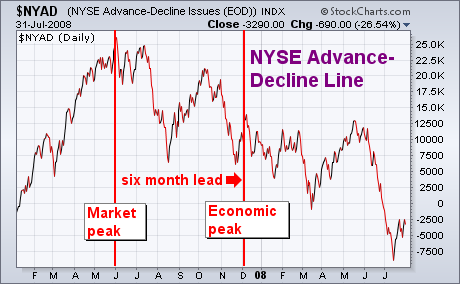
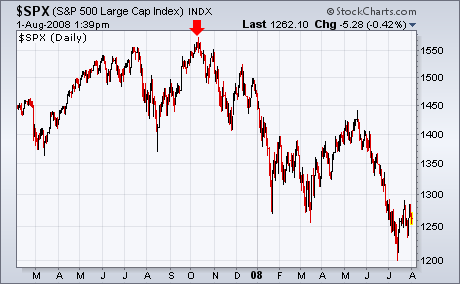
ECONOMISTS ARE LATE AS USUALby John Murphy | The Market Message In a recent Market Message, I discussed how the stock market is a leading indicator of the economy and why it isn't a good idea to use economic forecasting to trade the stock market. Historically, the market turns down at least six months before the economy. Chart 1 shows the NYSE Advance-Decline Line peaking last June. That suggested a possible recession by December of last year. Chart 2 shows the S&P 500 peaking last October. That puts the odds for a recession somewhere around April of this year. This week's economic reports showed that second quarter growth was below economic forecasts. It probably would have been even worse without a temporary boost from rebate checks. More importantly, GDP growth for the fourth quarter of last year was actually negative. It was reported this morning that the unemployment rate for July rose from 5.5% to 5.7% to the highest level in more than four years. A number of economists were quoted over the last two days saying that the economy was now in recession. Thanks for that late newsflash nearly a year after the stock market started dropping. These are the same folks who accused investors of panicing at the end of last year by using the "fear versus fundamentals" slogan that was flashed on TV screens. With the stock market now in an offical bear market, what are investors supposed to do with the newfound pessimism in the economic community? How many times do we have to repeat this cycle before people realize that the only way to trade the stock market is to study the market itself -- not the economy. The study of the market is what the charting approach is all about. And what Stockcharts.com is all about.
IWM AND QQQQ HIT RESISTANCEby Arthur Hill | Art's Charts
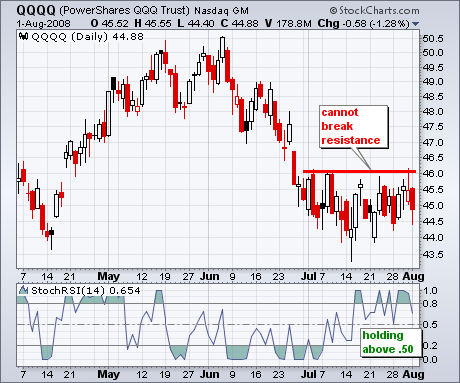
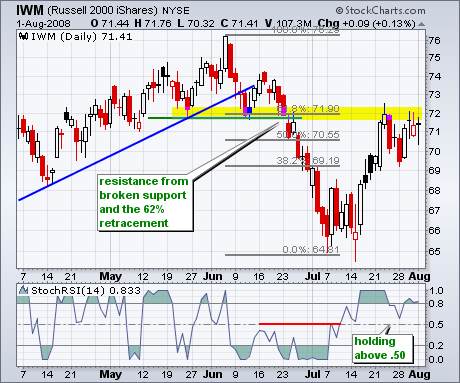
The Russell 2000 ETF (IWM) and Nasdaq 100 ETF (QQQQ) were stifled at resistance this week and the bulls are getting a test. After surging above 69, IWM met resistance at broken support and the 62% retracement mark. QQQQ met resistance at 46 in early July and this level held throughout the month. QQQQ shows relative weakness because the July breakout attempts failed. Both ETFs need to break resistance if the broad market rally is to continue.
Short-term momentum remains bullish for now. StochRSI is a nifty indicator that applies the Stochastic Oscillator to RSI. Yes, it is an indicator of an indicator. This makes it more sensitive than normal RSI and better suited for short-term signals. I like to think of it as RSI on Red Bull. On both ETF charts, StochRSI moved above .80 on 16-July and held above .50 since then. The surge above .80 turned short-term momentum bullish and the ability to hold above .50 kept the bulls in favor. For a counter signal that would turn short-term momentum bearish, I am watching for a sharp move below .20 in StochRSI.
There is also a videoversion of the this analysis available at TDTrader.com - Click Here.
RALLY LACKS CONVICTIONby Carl Swenlin | DecisionPoint.com
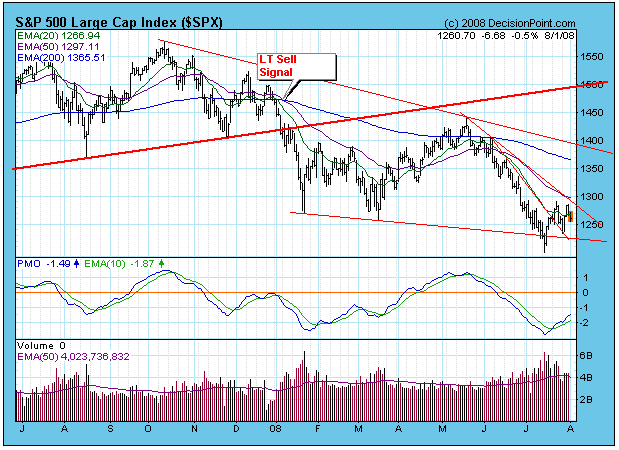
The rally that began nearly three weeks ago, out of the jaws of a potential crash, has become rather unimpressive in the last two weeks. As I said in my last article, the rally seemed to be contrived from the beginning, and support for the rally has faded rather than grown, as we normally see in bull market rallies. At this point (about an hour before the close on Friday), the technical chops seem to be lacking for the rally for the market to power upward to the primary declining tops line (in the area of 1375).
One of the things that is lacking is volume. As you can see on the chart below, initial volume was pretty good, but recent volume is substandard.
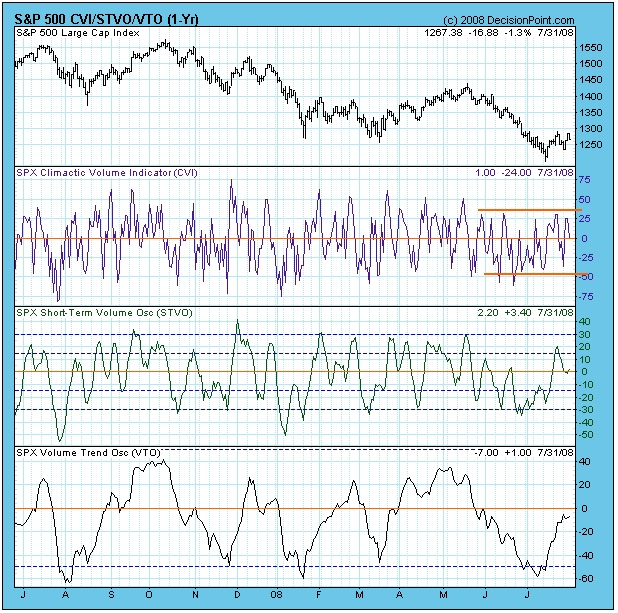
The next chart is one that always has my primary focus. The CVI (Climactic Volume Indicator) measures extreme OBV (On-Balance Volume) movement within the context of a short-term OBV envelope for each stock in the index. When a rally is launched from the deeply oversold conditions we have seen recently on virtually all our medium-term indicators, we expect to see the CVI move upwards to at least +50, and preferably to the +75 range. This kind of upward spike presents evidence of a broadly-based initiation climax, which indicates that most on the stocks in the index are participating in the new rally.
As you can see, over the last several weeks, the CVI has remained in a fairly narrow range, neither getting severely overbought or severely oversold (which would be a good bottom sign in these circumstances). It is clear from the chart that CVI overbought spikes do not always result in extended rallies; however, I am certainly not confident in any rally that does not have such a spike.
Finally, the chart below has three medium-term indicators -- one for price, breadth, and volume. It is typical of most of our medium-term indicators, reflecting extremely oversold conditions at the July low. While we normally expect these conditions to result in a pretty vigorous rally, so far the oversold condition is being cleared with a not very inspiring price advance. This indicates that there was not much compression associated with the oversold conditions, compression which would be needed to power prices significantly higher. Another way to say it is that there was no build up of buying pressure, even though selling pressure seemed to have become exhausted.
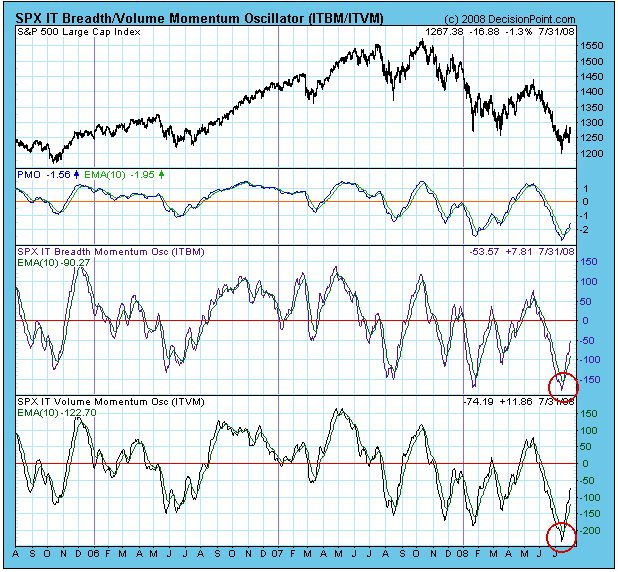
Bottom Line: If we keep the fact that we are in a bear market foremost in our mind, it will help us maintain our guard, and temper our enthusiasm for positive market action. If the rally continues, more buy signals will be generated by our primary timing model, but I suspect that these will result in whipsaw. Long positions should be managed on a short-term basis.
EARLY BULLISH SIGNS EMERGING?by Tom Bowley | InvestEd Central Spotting tops and bottoms is perhaps the best reason for utilizing technical and sentiment indicators in your investing and trading arsenal. The first signs of a bottom forming can be subtle and I'm beginning to see a few. Consumer discretionary stocks, which have been relative laggards during the market weakness, are showing slight signs of relative strength and on a longer-term weekly chart have printed a long-term positive divergence. Take a look at Chart 1:
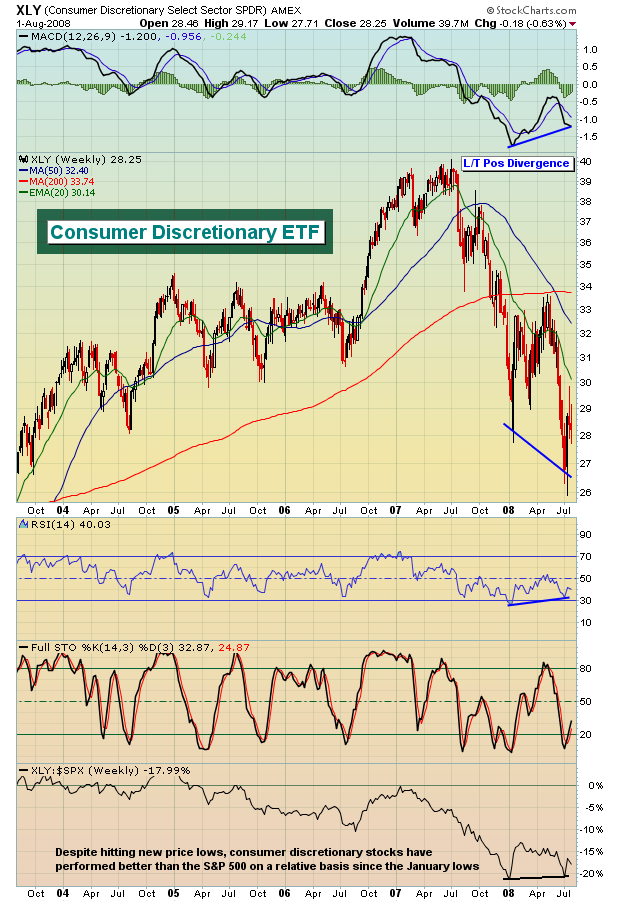
Given the steep increase in crude oil prices over the first half of 2008, it's surprising that consumer discretionary stocks have held up as well as they have on a relative basis. The Conference Board Consumer Confidence Index increased in July (reported July 29th as of July 22nd) for the first time since December. One month's increase doesn't make a trend, but it certainly bears watching. Consumer confidence is important not only because it reports the consumer's view of current conditions, but it also provides the consumer's view of future expectations. A further deterioration in crude oil prices would likely have a bullish effect on the consumer discretionary sector and by the looks of the crude oil chart below, further deterioration is becoming more likely.
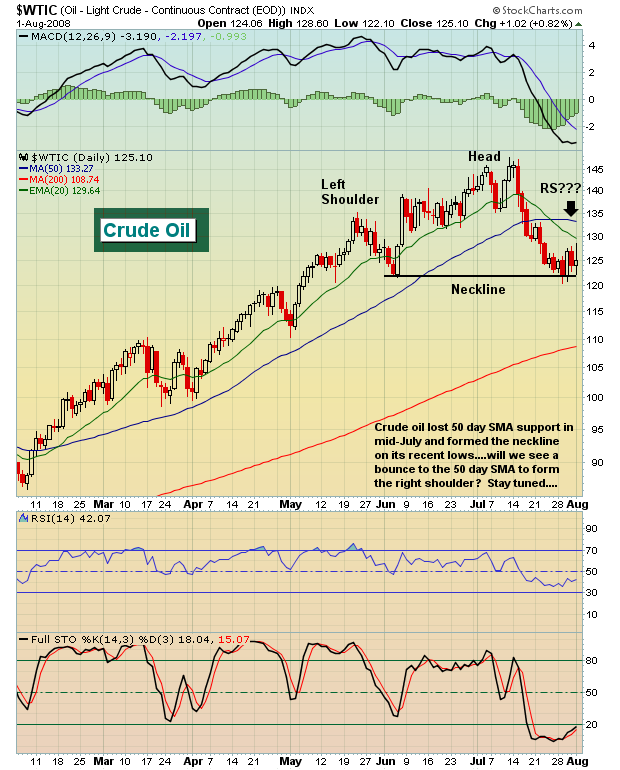
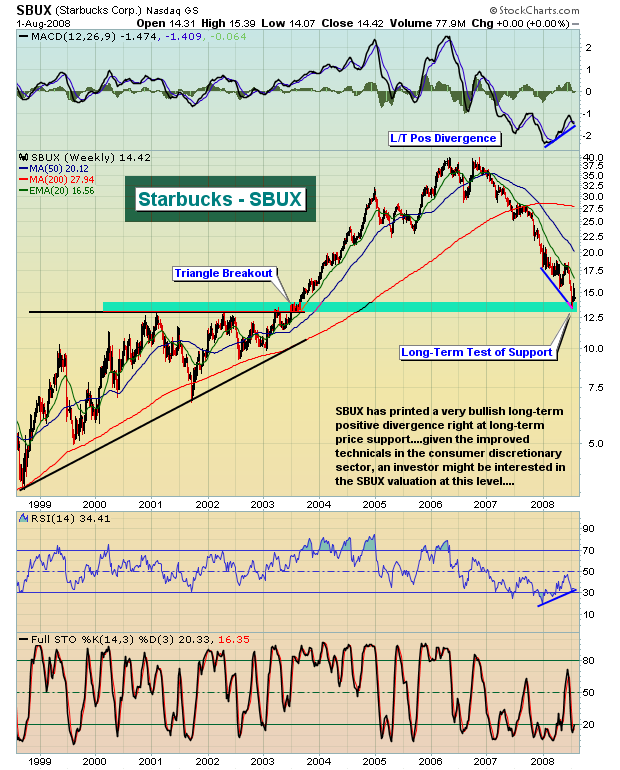
If crude oil breaks that head & shoulders pattern to the downside, the measurement would be to the $98-$102 area. One of my favorite stocks in the consumer discretionary group from a long-term perspective is Starbucks (SBUX). At Invested Central, we trade stocks, we don't invest for the long-term. However, the technical picture of Starbucks (SBUX) is quite compelling for a longer-term investor. The name brand is obvious and on the heels of a horrible quarter, you can pick it up on the cheap. Take a look at the long-term weekly chart below:
Until next time...
Happy trading!
Join Tom and the Invested Central team at www.investedcentral.com. Invested Central provides daily market guidance, intraday stock alerts, annotated stock setups, LIVE member chat sessions, and much, much more.
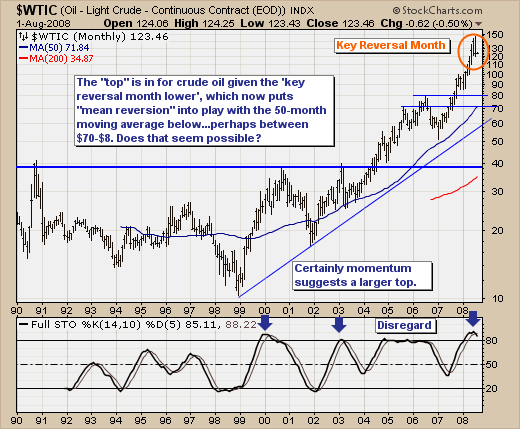
QUESTIONS FOR THE FUTUREby Richard Rhodes | The Rhodes Report This past July-2008 was a very important month for the capital markets; crude oil peaked and traded lower by -11%. This is rather substantial to be sure, and one would be reasonable to believe that the demand/supply equation coupled with a daily technical oversold condition would push crude prices back higher. Perhaps it shall in the short-term, but we fear any and all rallies are going to be sold and sold rather aggressively to push prices towards $100/barrel by the November election. The reason as to the "why and how" it does so is left to the benefit of time.
We on the other hand, will note perhaps the most bearish of reversal patterns in crude oil - the "monthly key reversal lower." This simply denotes exhaustion of the previous trend as July saw new highs above June's, while new lows printed below June's lows as well...with prices closing virtually on their lows as well. We'll now argue that mean reversion is firmly in place, with a downside target of a meeting with the 50-month moving average currently near $70/barrel. Now given this is a monthly chart, it may take a great deal of time to get there - and perhaps the moving average does move higher to meet prices at some point. That is a question for the future; we are now concerned that crude oil prices are headed lower and what the impact shall be upon the broader stock market. Will it be positive as it "juices" the consumer; or is it part of the de-leveraging process that sends the broader market and all sectors lower? Good questions...and we'll explore those in the days and weeks ahead.
