| |
|
|
|
|
| |

|
ChartWatchers
the StockCharts.com Newsletter
|
|
|
|
|
|
|
|
"WEATHERING" THE MARKETby Chip Anderson | ChartWatchers
When was the last time you saw a 100% accurate weather forecast for your area? Chances are that at least some of the weather predictions your local weather person tells you won't come to pass. In many cases, most of the predictions are wrong. So why do we keep listening to weather forecasts?
Weather forecasts are useful because they help us prepare for what is likely. If the forecast calls for rain, we bring our umbrellas with us when we go out. If sunshine is predicted, we bring our sunglasses. We know that we might not need these things, but more than likely we will and we like to be prepared.
Technical analysis is very similar to weather forecasting. Good technical analysts know that T/A can prepare you for what is likely to happen but, just like many weather forecasts, things can change in unpredictable ways. Here are some other ways that technical analysis is like weather forecasting:
- Weather forecasters measure temperature and air pressure and then use that data to determine more about the factors that cause weather changes - i.e., fronts, high pressure, low pressure, etc. Technical analysts use price and volume to determine more about the factors that cause market changes - i.e. fear and greed, trends, reversals, support, etc.
- Despite huge quantities of weather data at their disposal, weather forecasters still use their experience and intuition when creating each forecast. Technical analysis also draws heavily from the experience and intuition of the person doing the analysis (you!).
- Accurate weather forecasting requires local knowledge and experience. A forecaster from Florida that moves to Alaska will need time to become familiar with Alaska's weather patterns. Similarly, technical analysis requires experience and knowledge about the kinds of markets being charted - stocks are different from commodities which are different from mutual funds, large stocks are different from small stocks, etc.
- In the early days of weather forecasting, charlatans tried to convince people that they could somehow control the weather or that their predictions where always accurate. Unfortunately, even today, you can find people making similar claims about technical analysis.
- Weather forecasts tend to be most accurate when things aren't changing. If it has been sunny for the past three days and no big weather systems are approaching, chances are it will be sunny again today. Technical analysis also works well when conditions aren't changing dramatically. Both disciplines have more trouble with predicting exactly when big changes will occur.
- Both weather forecasting and technical analysis work well for the "mid-sized view." While predicting the weather for a large city is possible, predicting things for a city block is very hard. Similarly, second-by-second technical analysis can be extremely tricky; daily and weekly analysis is more reliable. Conversely, predicting weather for the country as a whole (i.e., "It will be sunny in the US today") and predicting the market as a whole (i.e., "This year stocks will go up") are too broad to be useful.
It is easy to lose perspective on what technical analysis can and cannot do. Try to remember this comparison with weather forecasting to keep yourself aware of its benefits and limitations.
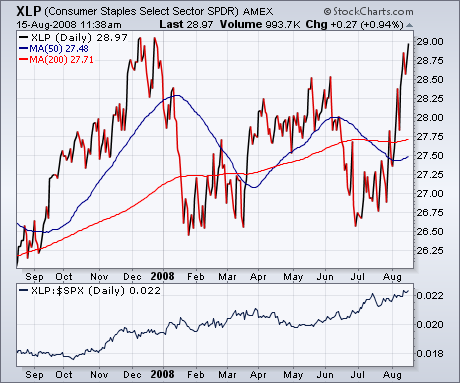
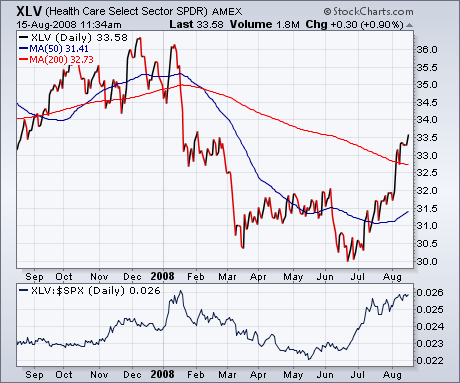
Until proven otherwise, the two strongest market sectors are still consumer staples and healthcare. And both are defensive categories. Chart 1 shows the Consumer Staples Select (SPDR) trading at a new eight month high after breaking through its spring high. It's nearing a test of its record high formed last December. Its relative strength ratio (below chart) has been rising since last summer when the market started to peak. Chart 2 shows the Health Care SPDR (XLV) bottoming at the end of June. The XLV has exceeded its spring high and its 200-day moving average. Its relative strength line turned up during May when the last market rally ended. The simplest way to play the two sectors is through these ETFs. If you're a stock picker, there are lots to choose from.
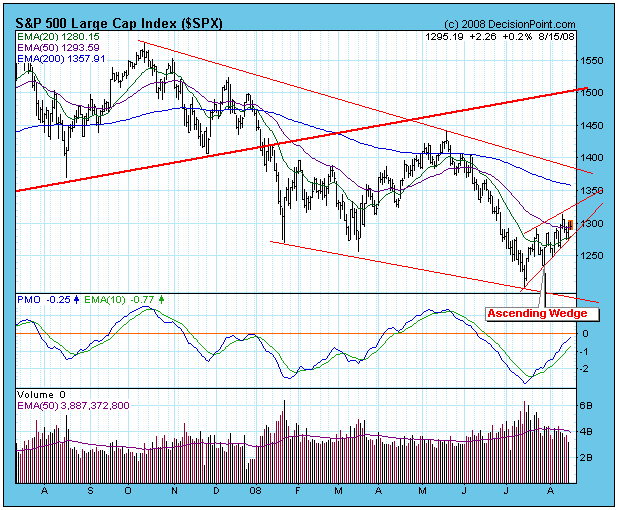
The rally that began off the July lows has not demonstrated the kind of strength we normally expect from the deeply oversold conditions that were present at its beginning. Instead, the meager price advance has served only relieve oversold compression and advance internal indicators to moderately overbought levels. In the process, as the chart shows, the price pattern has morphed into an ascending wedge formation, a bearish formation that usually breaks to the downside. Since we are in a bear market (the primary trend is down), odds of the negative outcome are increased.
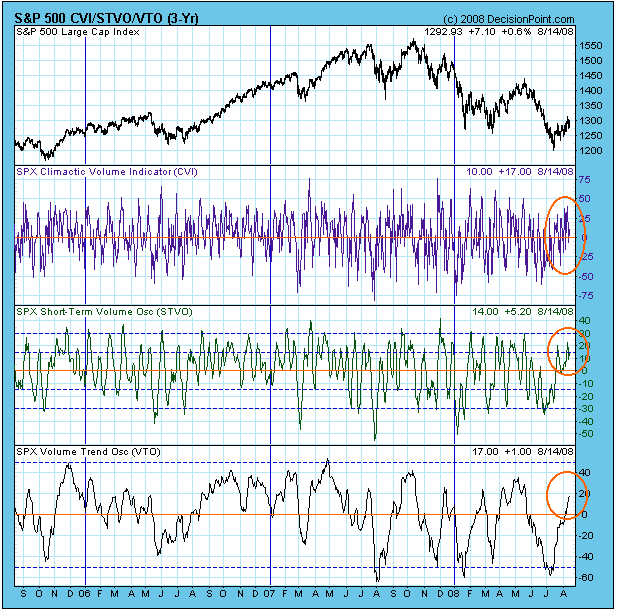
The next chart shows our On-Balance Volume (OBV) Indicator Set. The Climactic Volume Indicator (CVI) measures extreme OBV movement within the context of a short-term OBV envelope for each stock in the index. The Short-Term Volume Oscillator (STVO) is a 5-day moving average of the CVI. The Volume Trend Oscillator (VTO) summarizes rising and falling OBV trends. These charts tell us if the index is overbought or oversold based upon volume in three different time frames. All three are giving us useful information at present.
The CVI shows that upside volume climaxes have been quite mediocre, certainly well below the levels that we see when significant rallies are launched. The STVO and VTO show that the oversold conditions that existed at the July low have been cleared, and that the market is beginning to become overbought. With overbought internals and a bearish chart formation, we should be expecting a correction very soon.
A correction would not necessarily be a bad thing. The July low needs to be retested on a medium-term basis, and a successful retest would set up a broad double bottom, suitable to support a decent rally; however, in my estimation, prices will need to go a lot lower than they were in July before internals will be sufficiently oversold to fuel a healthy advance.
A bullish take on current conditions would emphasize that the subject ascending wedge is a short-term condition, and any downside resolution is likely to be short-term as well, meaning that a very short correction could result in a higher low that keeps the rising trend intact, albeit at a less accelerated angle. There could even be an upside breakout from the formation, but that is a long shot.
Bottom Line: While our trend-following model has us on an intermediate-term buy signal, my opinion is that we should expect a correction which, at the very least, will retest the July lows. Since we are in a bear market, there is also a strong possibility that any correction could be the start of the next leg down. The dollar has bottomed and is beginning to trend higher for the first time in several years. Dropping crude oil prices are pushing gas prices lower at the pump and the dollar is strengthening. That's a combo that should make most consumers feel wealthier in time. Europe's economic woes as well as weakness in other parts of the world is putting pressure on foreign currencies. With the Federal Reserve here in the U.S. on hold - at least for now - the dollar is strengthening on a relative basis to its foreign counterparts. What's good for the greenback is not-so-good for commodities. The commodity run appears to be over. I'd be a seller into strength. The technicals have quickly deteriorated to levels not seen in the last few years. The strength in the dollar will make it difficult for commodities to regain their earlier form. Take a look at Chart 1 below to see how the technicals on the dollar are beginning to change for the better.

For the first time in over two years, the dollar has moved above the 50 week SMA. While the dollar could encounter some short-term resistance near 78, the long-term resistance area will be in the 80.00-80.50 range. Should the dollar push through that resistance, I believe we'll challenge the 92.50 level possibly by the end of 2009 or early 2010. A stronger dollar will push all commodities lower, but will especially hit gold hard. Until conditions suggest otherwise, you should consider trading the trend at hand.
In the July 19th issue, I discussed the effect of max pain and how the market gravitated higher to lessen the impact of net in-the-money put options. The same thing just occurred for August options expiration, only in reverse. Financials and consumer discretionary stocks had led a sizeable market rally into the beginning of this week. I calculated on Monday evening that the XLF (ETF tracking financials) had $118 million in net in-the-money call option premium. I'm only talking about one ETF here, so you can imagine what the total value of net in-the-money calls were at Monday's close across all index, stock and ETF options. Tuesday's decline in the XLF erased $67 million of this net call premium and Wednesday's 61 cent drop finished off the rest. JP Morgan Chase (JPM) had one of its worst days ever on Tuesday, wiping out millions of in-the-money call premium. Stock prices tend to gravitate towards the area of max pain, which is the price point where in-the-money call premium equals in-the-money put premium. While this gravitational pull doesn't work with every stock or sector at every expiration date, I'd caution any trader from trading stocks during options expiration week without first checking the underlying open interest. A quick glimpse at the open interest and in-the-money call and put options could save your portfolio dearly.
If you're not familiar with the concept of max pain or are interested in seeing how it might help your trading, follow the link below to an audio/video presentation that was done on Tuesday for our members. The presentation was shortened to highlight the discussion of max pain as it pertained to several stocks - mostly commodity stocks. I think you'll find it interesting at the very least. Go to www.investedcentral.com/maxpain.html for more details.
Happy trading!
Join Tom and the Invested Central team at www.investedcentral.com. Invested Central provides daily market guidance, intraday stock alerts, annotated stock setups, LIVE member chat sessions, and much, much more. The past month in the commodity markets has been a treacherous as we have seen it in recent years; and not one commodity has been spared. That said, our focus is upon gold futures given they have dropped from a high of $1,033.90 to their current level of $792.10, which is hard upon what we believe is major trend support at the sharply rising 20-month moving average. Quite simply, since, the 2001 breakout above this level - prices have returned to the 20-month on several occasions, and in each and every case this has been the proper time to be a buyer. Thus the question becomes whether this time is different...or not.
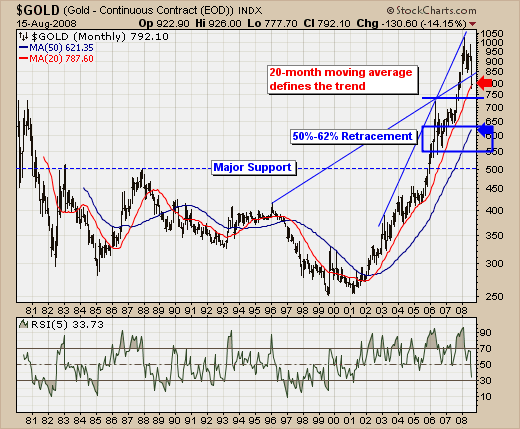
Obviously, one could very well make the bullish case as history is on one's side, with the risk as rather well-defined by a -2% breakdown below the 20-month level, which would put the stop at about $772.00. Friday's low trade for gold futures was $777.70, of which prices rallied roughly $15 off their low. Is this the requisite test of support and are higher prices forthcoming? Good questions to be sure; our only concern would be that it is different this time given the length of time prices have spent above the 50-month moving average - generally prices mean revert back to this level. Moreover, the 50%-62% retracement level consistent with bull market corrections stands at $550-$640...which is also where the 50-month crosses. Hence, one has to define one's time horizons.
In ending, we believe a short-term rally is developing to upwards of $850, but that is about as far as it goes. Of course we would reassess once our target was approached, but we would so with thoughts that an intermediate-term leg lower towards the retracement level is highly probable.
Good luck and good trading,
Richard Rhodes
|
|
|
|
|
|
|
|
|
|
|
|
|
|
|