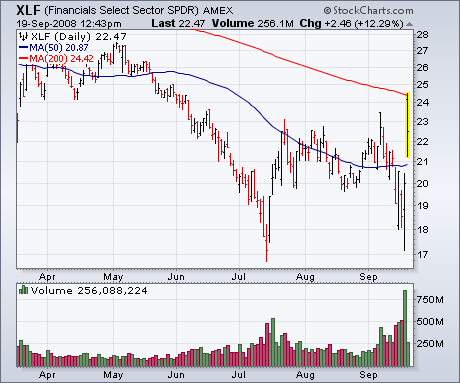
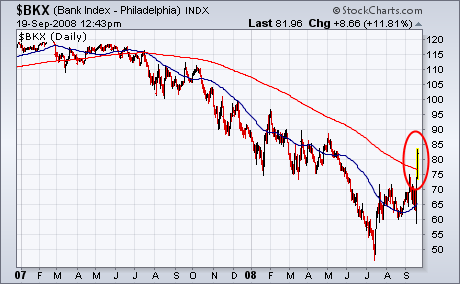
A massive government rescue plan and a temporary ban on short selling has boosted the Financials Sector SPDR by nearly 12% (Chart 1). It's the day's strongest sector on a day when all sectors are in the black. Brokers (not shown) are up 12% and banks nearly a similar amount. Chart 2 shows the PHLX Bank Index trading over its 200-day moving average for the first time in more than a year. If the financials can hold most of those gains through the end of the day, it will be a big positive for them and the rest of the market.
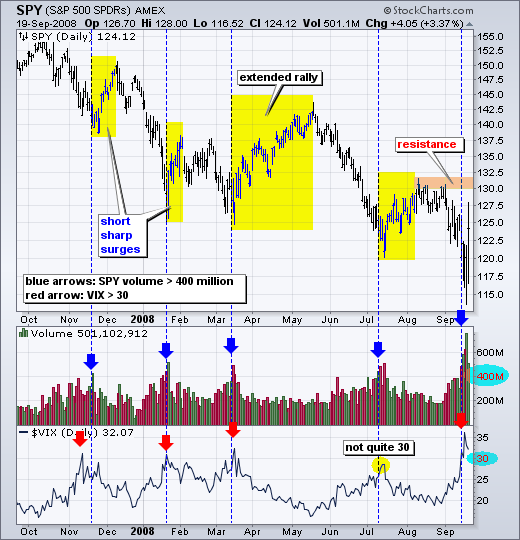
Volume and volatility surges foreshadowed bear market rallies in November, January and March. Both surged again this week and the market took notice with a huge bounce over the last two days. The chart below shows the S&P 500 ETF (SPY) with volume and the S&P 500 Volatility Index ($VIX). The blue
arrows show volume surges above 400 million shares, while the red arrows show VIX surges above 30. A volume surge after an extended decline reflects a selling climax or capitulation that exhausts selling pressure. Similarly,a VIX surge above 30 reflects excessive bearishness that can lead to a rally. Of note, the VIX fell just short of the 30 threshold in July, but SPY volume surpassed the 400 million mark. Even though this pairing is not perfect, it is still helpful in identifying the confluence of excessive bearishness and capitulation. With a surge over the last two days, a bounce is clearly underway. Unfortunately, there is no way to tell how long the bounce will last or how far it will extend. The November and January bounces were short-sharp affairs that lasted just 2 weeks. In contrast, the March advance lasted two months and the July rally lasted a month. One thing is for sure, there is a ton of resistance around 130-132.
There is also a video version of the this analysis available at TDTrader.com - Click Here.
In my September 5 article I said that I thought is more likely that we would see a continued decline, rather than a retest of the July lows. This week the market blew out the July lows and was very near to crashing on Thursday. Then prices blasted up out of the lows in a dramatic upside reversal. There was good follow through on Friday, and now we must ponder if a significant bottom has been made.
With historic levels of fundamental turmoil in the financial markets, and unbelievable volatility in prices, it is extremely difficult to keep a level head and keep focused on technical basics. I am reminded of my flying days and the primary directives for emergency procedures.
- Maintain aircraft control (don't panic and crash for no good reason).
- Analyze the situation, and take corrective action.
I have always thought of these rules as being appropriate for handling all of life's problems, and they especially apply to the current problems in the stock market. No matter what your current situation, you can't go back and start over. You are stuck with what you've got, so do your best to work through it.
Getting back to the charts, we can see below that prices are still in a long-term declining trend channel, which currently defines the bear market. The rally is approaching a declining tops line, and it will probably penetrate that resistance and head higher, possibly to test the bear market declining tops line. The most interesting feature is the positive divergence between the PMO and the price index -- while price made a lower low, the PMO made a higher low.

There are also positive divergences on our primary breadth and volume indicators shown on the next chart. These positive divergences are bullish.
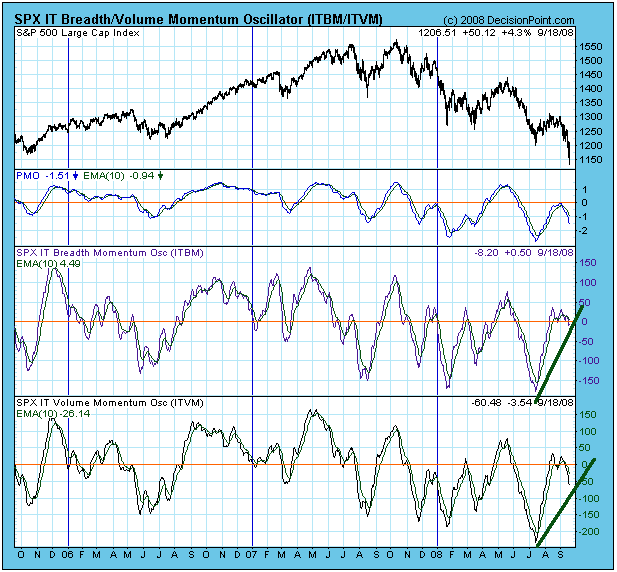
Our indicators and price action suggest strongly that we are beginning a rally that should last at least a couple of weeks. I also think that this week's deep low needs to be retested, and I am not convinced that a retest will be successful. My cycle work projects that a 9-Month Cycle low is due at the end of October -- about the time a retest would take place -- and cycle forces could take us to a new price low.
It is worth mentioning that the unprecedented avalanche of failures and bailouts is likely to get worse before it gets better, and we must wonder if a meltdown is over the horizon.
Bottom Line: While we continued to be buffeted by one crisis after another, the best thing we can do is "stay on instruments" (keep our eyes on the charts). At present, the charts say the rally is likely to continue, albeit not at the current rate of climb. At the end of the day, we are still in a bear market, and we should expect that the rally will fail before prices can break out of the major declining trend channel.
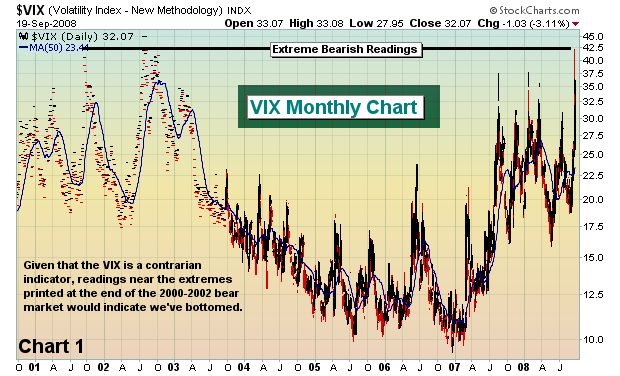
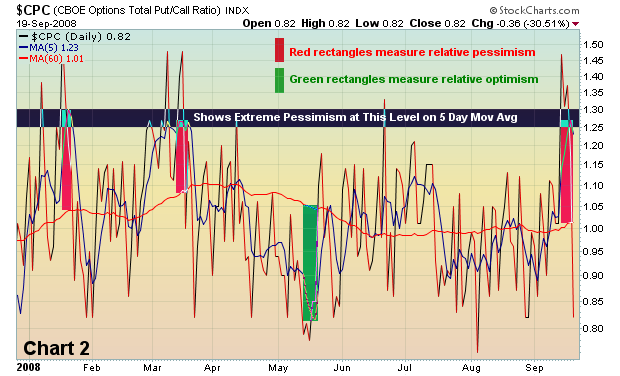
Market bottoms come in all shapes and sizes, but most have a few key ingredients. Without exception, critical market bottoms are borne out of excessive fear and panic. On Thursday, the VIX shot past 42. The last time we've seen the VIX that high, we were carving out the bottom of the 2000-2002 bear market (Chart 1). The equity only put call ratio touched 1.18 on Monday, signaling panic amongst retail investors. The 5 day moving average of the equity only put call ratio hit .95, exceeded only by the reading of 1.01 on March 17th - that was the day the market also saw a very significant bottom. I like to also measure the 5 day moving average of the total put call ratio and plot that against the 60 day moving avg to determine "relative" pessimism and optimism. As the spread between the two widens to extreme levels, bottoms and tops are formed in the market. The total put call ratio is highlighted in Chart 2.
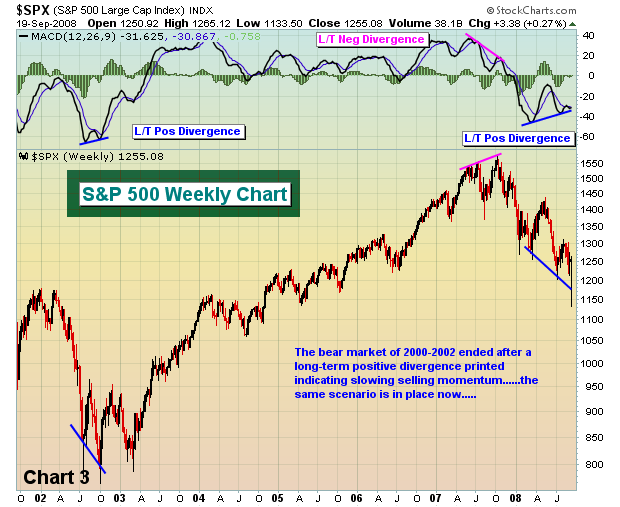
Why is this bottom different? I believe it's different because it's confirmed by a long-term positive divergence on the S&P 500 weekly chart (Chart 3). Positive and negative divergences on the WEEKLY charts appear infrequently. It's an advance sign that long-term selling momentum is waning (in the case of a positive divergence). A negative divergence implies that the long-term buying momentum is slowing. Chart 3 below provides a few excellent examples.
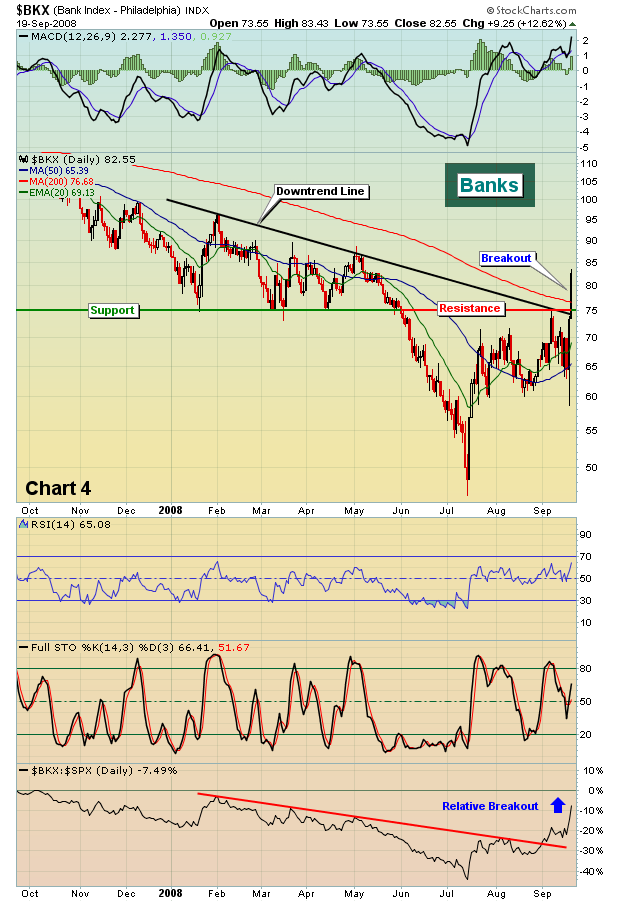
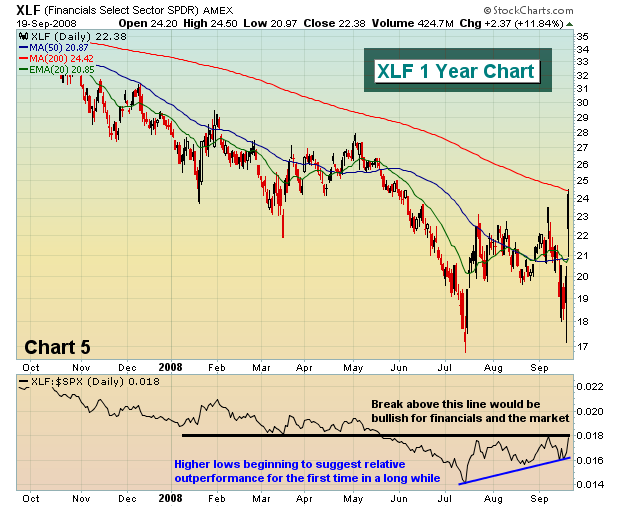
One group that must lead us out of the mess we've been in is the financials. On Friday, the bank index broke out above critical resistance - toppling both its recent downtrend line and also significant price resistance at 75 (Chart 4). The relative strength of financials has been on the improve for the last few weeks and that bodes well for the longer-term health of the market (Chart 5).
Of course, I cannot end this week's look at the market without a quick snippet about max pain. We just witnessed perhaps the most manipulated market behavior ever this week, and it's totally legal. At a time when financials needed help in the worst way, our government announced a resolution trust-type entity AND banned shorting financials until October 2. While the SEC absolutely should focus attention on naked shorting, I was shocked to see our government take a step away from a free market society by not allowing the shorting of financial shares, even if just for a brief period of time. Not only was it unfair - without any warning - but it violently manipulated the stock market the day before options expiration. Let me provide you a few facts as they existed at 1pm EST on Thursday afternoon. The SPY (ETF tracking the S&P 500) was trading at $113.80. The max pain on the SPY was $127.06. The amount of net in-the-money put premium totaled $1.95 BILLION!!!! After the rally Thursday afternoon and the massive gap up on Friday morning, the SPY opened at 126.70. $1.95 BILLION SAVED! Ring the register!
There were many more examples, but let me give you just one more. Goldman Sachs (GS), which had fallen to $86.85 on Thursday at its low, rallied to open on Friday morning at $142.51. Max pain was near $141.00. MILLIONS SAVED! Ring the register. Imagine the impact this had across all stock, ETF and index options. Rest assured it saved key financial institutions billions and billions of dollars.
If you haven't had a chance to listen to our max pain presentation, it is archived on our home page and it's FREE. It's well worth the hour or so to learn more about max pain and its impact on short-term market direction. As a bonus, it includes a discussion regarding The Bowley Trend and how you can benefit from historical market trends.
Have a great week and happy trading!
Join Tom and the Invested Central team at www.investedcentral.com. Invested Central provides daily market guidance, intraday stock alerts, annotated stock setups, LIVE member chat sessions, and much, much more.
We'll admit last week was one of the more "interesting" trading weeks we have seen in a number of years, and if we must liken it to anything we've seen in our 25-years of trading - it would be the week before and of the 1987 Crash. The question we and many others have is whether last week was "The Low" or just "A Low" in the stock market; and to be perfectly frank...we don't know. But perhaps the most important chart in our trading universe at the present time is the simple "tactical allocation" ETF ratio chart between stocks and bonds - we use the S&P 500 Spyder (SPY) and the Lehman 20+year Bond Fund (TLT) ratio as our guide. In essence, this is a "risk-aversion" chart.
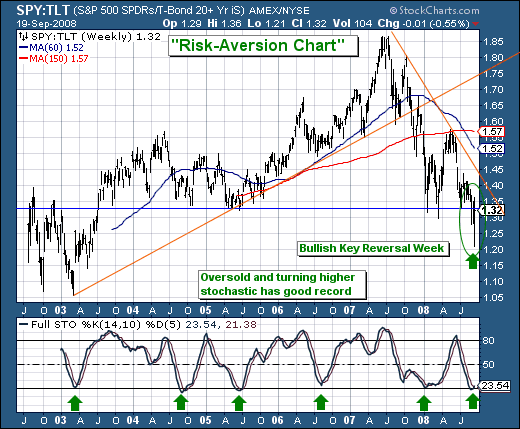
Quite simply, as stocks have moved lower, we've seen bond prices move higher/bond yields move lower as institutions/investors/traders have sought out the safety of the bond market at the expense of stocks. This resulted in the SPY/TLT ratio chart moving lower; and it has done so since July-2008 - breaking major support levels along the way. However, last week's unprecedented government intervention related to collapsing credit markets pushed stocks higher and bond prices lower/bond yields higher as market participants "feared" losing more money in the bond market as yields rose, with the only place to put that cash was in money market funds or in stocks - they chose stocks.
Hence, a bullish key reversal has formed off quite low levels, which the 14-week stochastic turning higher from oversold levels. In the past, this has led the ratio higher and coincided with higher stock prices. Whether or not we or you agree with the government intervention - the technicals are showing that last week was at least "a bottom", with the jury still out as to whether it was "the bottom." As we move forward, we'll certainly be able to fill in more of the myriad of technical blanks. Until then, sector and industry tactical long and short rotation will be paramount to outperformance.