THE NEW LANDSCAPEby Chip Anderson | ChartWatchers With all the changes happening in the financial world right now it's gotten really hard to keep up with the latest news. This bank is failing. That company is merging with this one. That sector is over exposed to the credit crunch. Etc., etc., etc.
One of the great things about technical analysis is that it works REGARDLESS of market conditions - you just have to remain calm and understand how to use the tools at your disposal.
In this case, as always, a great place to start is our S&P Sector Market Carpet. Here are all the stocks that make up the nine S&P sector ETFs in one easy-to-use display. By using the slider at the bottom, you can quickly see which sectors and stocks have been weathering the current storm the best. It is like a "visual Scan Engine."
Let's look at the long-term view of the current MarketCarpet:
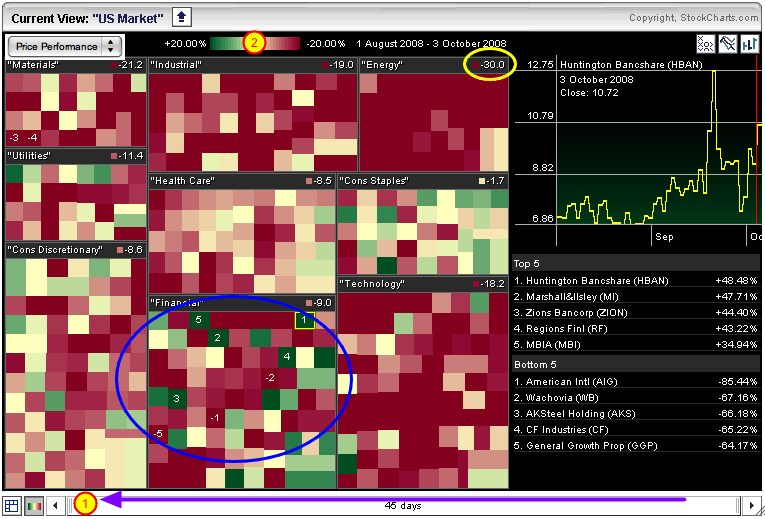
To create this chart, click on our "Market Carpets" link, then select the "S&P Sectors Carpet". Initially, you'll see a short-term view of things - two days long to be exact. But we are interested in the long-term situation. So the first thing to do is to use the mouse to drag the left edge of the slider at the bottom of the chart all the way over to the left side where "#1" is (see the purple arrow?). That will give us the Price Performance comparison for the past 45 days.
There is still a problem however. The carpet is almost all solid red or solid green. That's because the color scale at the top of the chart only goes from +5% to -5%. Since we are looking at a long term chart, we want to expand that color scale. Simply click where #2 is and the scale will expand to show +20% to -20%. Now there isn't as much solid red and solid green. That's all it takes to set up a long-term MarketCarpet.
There's still a bunch of solid red on the chart. Notice how Energy stocks in particular have been hammered. The stocks in that sector are down 30% on average (see the yellow circle?). Even though there are bigger losers in other sectors, the Energy sector has been hit the hardest over the past 45 days. The Materials sector is down 21.2% and Tech stocks are down 18.2%. Ouch.
But wait - what about all those bad Financial stocks we've been hearing about? The carpet shows that the story with Financial stocks is mixed and very volatile. Mixed in with the big losers like AIG and Wachovia (WB) are huge winners that you never hear about like Huntington Bancshare (HBAN) and Marshall & Isley (MI). Simply click on any of the green squares in the blue circle to see what those charts look like.
And what is the "strongest" sector these days? Not surprisingly, Consumer Staples is down the least - just 1.7% on average. Even though none of those stocks show up as big winners or losers, the lack of huge swathes of red in that sector really stands out.
The MarketCarpet shows you the "landscape" of the market. Don't forget to use it on a regular basis when looking for strong and weak stocks.
-- Chip
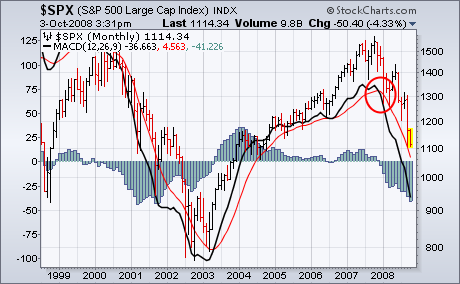
Over the past couple of weeks, I've suggested taking no new action in the stock market. Part of my reasoning is that we've been recommending a bearish strategy for the past year and see no reason to change that. Selling should have been done earlier in the year when major sell signals were first reported here. My January 3 Market Message reported on the major sell signal given by the monthly MACD lines last December (Chart 1). A number of other technical indicators also give major sell signals at the start of the year that we reported on. None of those sell signals have been reversed and we've made several bearish recommendations since then. I realize that there are opportunities for short-term traders. My main focus, however, remains on intermediate and major trends. Since there's little justication for buying, the main question is whether we should be doing more selling at the moment. Here's why I don't think October is a good time to sell.
FILTERING THE NOISEby Arthur Hill | Art's Charts
September was one of the most volatile months in recent memory. Bar charts and candlestick charts are great, but the wild high-low swings can interfere with basic trend analysis. Moving averages provide a good means to smooth this volatility by cutting through the daily noise. For those who want it all, a combination of high-low-close bars and a short moving average may even be appropriate. This combination shows the high-low range, but also focuses on average prices to discern a trend.
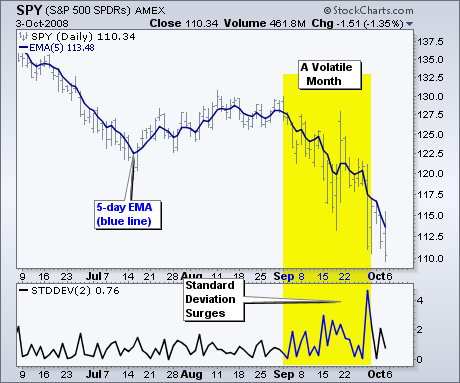
The accompanying chart shows the S&P 500 ETF (SPY) with bars in gray and a 5-day EMA in blue. Even though September has been exceptionally volatile, the 5-day EMA shows a steady downtrend. In fact, the 5-day EMA does not look any more variable than the prior months. Despite Tuesday's big rebound, this EMA hit a new low to affirm the downtrend that began August.
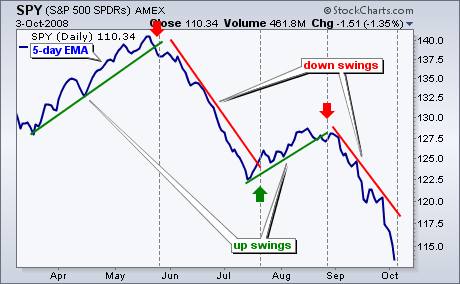
The second chart shows the 5-day EMA without bars or candlesticks. It is a pretty empty chart, but it sure cuts through the clutter. There are four trendlines that denote the swings over the last six months. The current swing is down and the decline even accelerated this week. SPY may be oversold, but it is clearly in the falling knife category as the 5-day EMA dropped over 5% this week. As this trendline now stands, the 5-day EMA needs to move above 119 to reverse this down swing (break the trendline).
There is also a video version of the this analysis available at TDTrader.com - Click Here.
BUYING OPPORTUNITY?by Carl Swenlin | DecisionPoint.com
In my September 19 article I said: "Our indicators and price action suggest strongly that we are beginning a rally that should last at least a couple of weeks. I also think that this week's deep low needs to be retested, and I am not convinced that a retest will be successful." As it turned out, there was no rally and the expected retest and failure encompassed one of the worst one-day declines in history.
From top to bottom the S&P 500 Index has dropped nearly 30%, but as usual we can't turn on financial news without hearing somebody assert that this is now the "buying opportunity of a lifetime". I wish it were, but in my opinion it is not. For it to be that great a buying opportunity stocks would have to have extraordinary fundamental value, and that kind of condition has not existed for over 20 years.
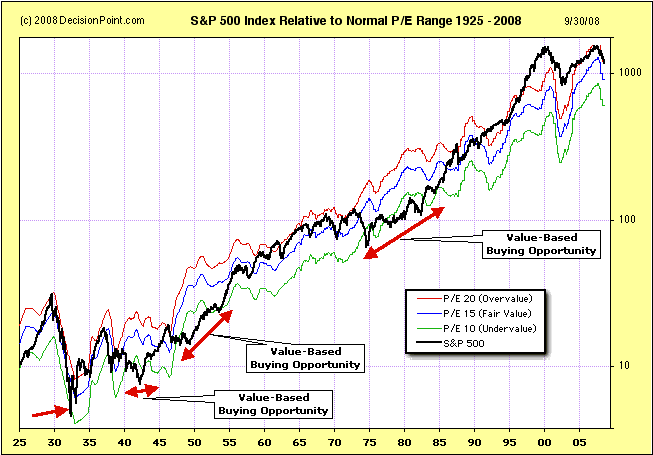
Based upon 2008 Q2 GAAP earnings the P/E of the S&P 500 is about 21, which puts it slightly above the normal P/E range of 10 to 20, meaning that stocks are very overvalued (the exact opposite of being a bargain). To demonstrate, the chart below displays the S&P 500 in relation to its normal P/E range going back to 1925. The S&P 500 is the heavy black line, the red line shows where the S&P 500 would be if it had a P/E of 20 (overvalued), the blue line is if the P/E were 15 (fair value), and the green line represents a P/E of 10 (undervalued).
I have applied red arrows to identify the periods where stocks were truly undervalued, sometimes mouth-wateringly so -- truly buying opportunities of a lifetime. As you can see, current prices are very overvalued, and possibly near the selling opportunity of a lifetime. To those who think this is the time to buy, I must ask, based upon what? Clearly, prices can rise even when stocks are overvalued, but current economic fundamentals makes that outcome a long shot.
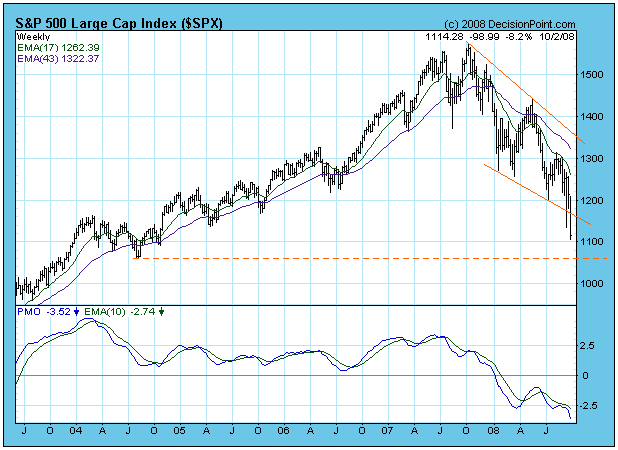
As for our market outlook, the next chart puts the decline in perspective. Prices are deeply oversold, as are many of our technical indicators, so it is reasonable to expect a rally to clear this condition; however, we are in a bear market, and I have no reason to believe that the recent lows are the final bear market lows. There is a 9-Month Cycle trough due around October 22, and it is possible that it arrived early at the recent lows. Otherwise, we should probably look for a bounce followed by a retest of the lows in late-October.
My view of the financial crisis is that it is going to last a long time, and that there will be no easy fix, even if we had some really smart people trying to solve the problem, which we do not. Three weeks ago most congress persons had no more awareness of the problems we are facing than the man on the street. How much confidence do you have that the very people who caused the problem are suddenly going to become smart enough to fix it? In my opinion, they are only going to make it worse.
Bottom Line: Stocks are way overvalued and the economic outlook is dismal. The only long exposure that should be considered is on a short-term basis when the inevitable bear market rallies occur.
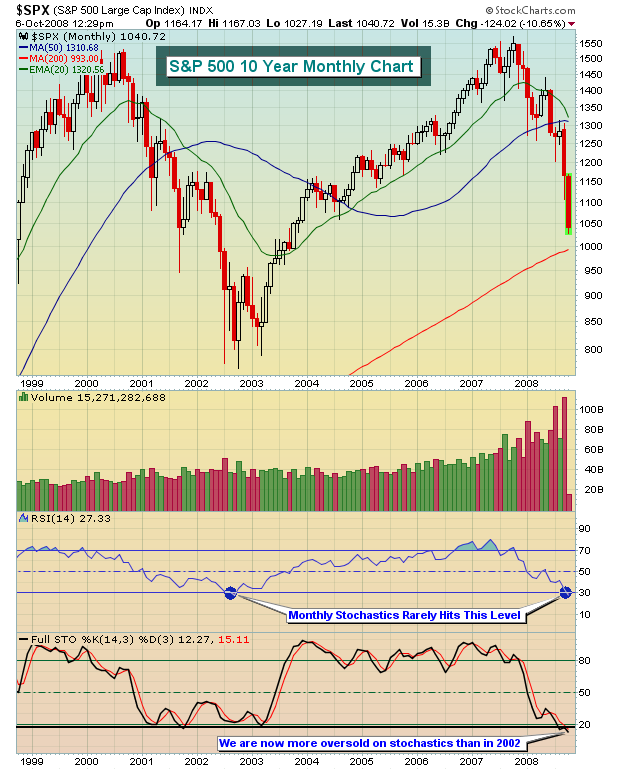
SEPTEMBER WEAKNESS SPILLING OVERby Tom Bowley | InvestEd Central Two weeks ago, I said to buy the bottom. Sometimes, you're just wrong. I was wrong. Technical analysis is to the study of price action to increase the odds of predicting future price action. It's not an exact science, there are no guarantees, and there are times when you just have to tip your hat to the other side. So far, that's been the case. The market fell precipitously this past week, closing at new lows across our major indices. Volume was increasing late in the week, though it wasn't as heavy as we saw a couple weeks earlier. We can argue that it was the fault of Congress for acting too slowly. Others might argue that the bailout bill itself is the problem. From a technical perspective, the reason for the decline doesn't really matter. We're only concerned about what happened technically with the price action. We must always respect the combination of price/volume breakdowns, regardless of what other technicals are indicating. From the following monthly S&P 500 chart, you can see that we are as oversold now as we've been since the bottom of the bear market in 2002. Monthly RSI has moved below 30 and stochastics are approaching single digits, something that never happened in the 2000-2002 bear market.
We knew that September was historically weak and this past September certainly did nothing to disprove that notion. Since 1950 on the S&P 500, September is the only calendar month that has moved lower as opposed to moving higher. It is also the only calendar month that has negative annualized returns over the past 58 years. What many market participants don't realize is that Mondays are - by far - the worst day of the calendar week. Since 1950, the annualized return on Mondays (on the S&P 500) is a negative 16%. While I've done no study, I'd bet that psychological forces have a lot to do with it. But what's interesting is that if you had simply avoided trading on Mondays since the May 19th top (or shorted), your performance would likely have been much, much better. Consider the following: Since May 19th, we've had 17 Mondays, 12 of them the S&P 500 has moved lower. Of the 5 that have moved higher, only 1 (September 8) moved up more than 1%. Of the 12 down Mondays, 9 moved down more than 1% and 6 moved lower by 2% or more. Perhaps most astonishing is that the S&P 500 has lost 327.40 points since the close on May 19th, dropping from 1426.63 to 1099.23. The cumulative point losses on Mondays total 328.27, 100% of the decline. For comedy movie buffs who have seen Office Space, the stock market has had a REALLY "bad case of the Mondays".
Join Tom and the Invested Central team at www.investedcentral.com. Invested Central provides daily market guidance, intraday stock alerts, annotated stock setups, LIVE member chat sessions, and much, much more.
WHERE ARE WE NOW?by Richard Rhodes | The Rhodes Report
The bear market reasserted itself last week in a violent manner; trading sharply higher and lower in a matter of hours and days. This isn't your garden variety bear market as this one smells and feels much different given the enormity of the credit crisis. And there is no end in sight to the crisis from a fundamental perspective, which is giving rise to increasing calls that a "crash" is imminent. Perhaps that indeed what lurks around the corner, but crashes are very low probability events as they reside at the "end of the tail" of the probability distribution curve. We would argue we've had a serious of "mini-crashes" if one looks at the homebuilders; the oil and oil service sector; and the commodity miners. The decline in the homebuilders took 2-years to accomplish, while the oil/oil service and commodity miners took all of 3-months.
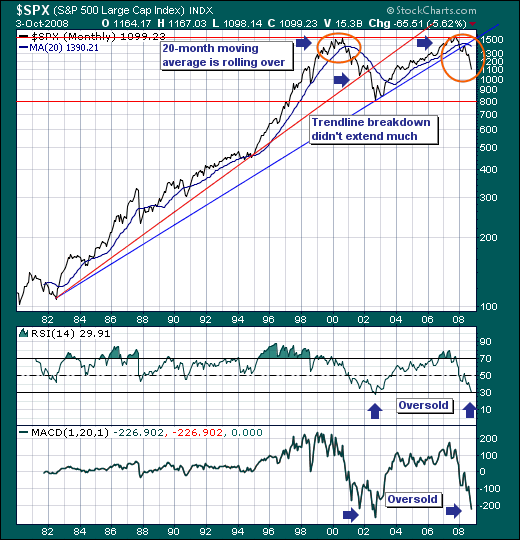
The question where does that put us now is a very good one. From a longer-term technical perspective, the S&P monthly chart has broken below its longer-term bull market trendline which would argue for sharply lower prices. However, the 14-month RSI is oversold for only the second time since 1980, with the other time occurring at the October-2002 bottom. This certainly puts the risk-reward towards a countertrend rally in the least. Shorter-term, we find the price distance below the 20-month moving avearge to be on par with that seen at other interim 2000-2002 bear market lows. The 1050-1080 zone is about as low at it gets. Again, this would argue for countertrend rally in the least.
Therefore, the risk-reward favors a tradable rally from current-to-lower levels as quite a bit of negative news has been discounted; the question however, still remains whether the rate of increasingly bearish fundamental news and earnings will overwhelm the technicals. It's all about risk-reward, and it would seem to us barring a low probability crash...we should be considering long positions into this decline.