| |
|
|
|
|
| |

|
ChartWatchers
the StockCharts.com Newsletter
|
|
|
|
|
|
|
|
Hello Fellow ChartWatchers,
As you (hopefully) know already, StockCharts.com also has an online bookstore that is dedicated to providing great investment-oriented books at great prices. (We work hard to keep the prices as low as possible. No, seriously! From a business perspective we just want to break even on our books.) But there is one book in particular that we look forward to selling each year. Year after year it is our biggest seller mostly because it gives out great information that everyone can use to make better investments.
If you haven't guessed already, I'm talking about "The Stock Trader's Almanac" by Jeffrey and Yale Hirsch. If you have seen it before, simply click here to order your 2009 copy - you are already sold on it I'm sure.
If you haven't seen The Stock Trader's Almanac, then you are in for a huge treat. Anyone that likes charting or trading systems or historical trends or easy to follow trading systems will love this book cause it is full of all that stuff. Part daily planner, part historical market compendium - The Stock Trader's Almanac can show you exactly (for example) what the markets have done after each Presidential election going back to Calvin Coolidge. Want to know what day of the week is the best day to buy stocks? The Stock Trader's Almanac can show you and show you the data to back up its conclusion. There are hundreds of other similar market facts throughout.
The Almanac even has its own blog where you can keep up with the latest research from the authors: http://stocktradersblog.blogspot.com/
It's a great resource and we have it at a great price. For the next two weeks, you can get the 2009 edition of the Stock Trader's Almanac from our bookstore for only $25.95US. That's $6 cheaper than what the publisher sells it for. It's even cheaper than what Amazon sells it for(!).
Long-term ChartWatchers know that I only make sales-pitchey type posts like this very rarely and when I do, it's something worth a close look. This is one of those times. Take a second and see for yourself. You won't be disappointed.
-- Chip
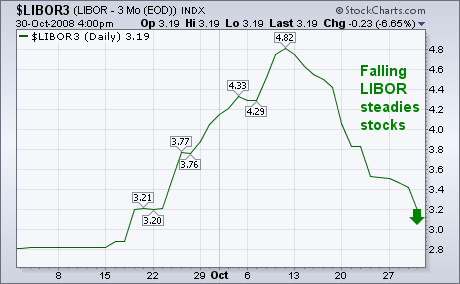
LIBOR DROP ENCOURAGES MARKETSby John Murphy | The Market Message One of the recent positive trends is the continuing drop in the three-month London Interbank Overnight Lending Rate (LIBOR). That rate determines what banks charge each other for loans. During the credit freeze that started in mid-September, the LIBOR jumped from 2.8% to 4.8% as stocks fell sharply. Since mid-October, however, the LIBOR has been dropping. It fell another 16 basis points today to 3.03 (see arrow) which is the lowest level in six weeks. That's helping to stabilize global stock markets.
AIRLINES TAKE OFFby Arthur Hill | Art's Charts
The Amex Airline Index ($XAL) is leading the market higher with a break above two key moving averages this week. XAL produced one of the sharpest October recoveries with surge from 14 to 25 over the last three weeks. This surge carried the index above the 50-day moving average and 200-day moving average. Both moving averages are still moving lower, but this October surge shows extraordinary strength. Not too many indices are currently trading above their 200-day moving average. For example, the S&P 500 is some 30% below its 200-day moving average.
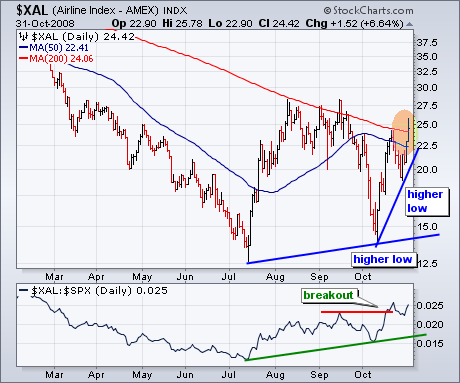
In addition to these moving average breakouts, XAL shows relative strength versus the S&P 500. First, the S&P 500 broke below its July low, but the
Airline Index held above its July low. Second, the S&P 500 tested its mid
October low last, but the Airline Index held well above its mid October low.
These two higher lows show that the Airline Index is holding up better than the S&P 500. Third, the bottom indicator window shows the Price Relative, which shows the performance of XAL relative to SPX. This indicator formed a
higher low in October and broke above its September high this month. A
breakout in the price relative confirms relative strength in the Airline
Index.
There is also a video version of the this analysis available at TDTrader.com - Click Here. CHANGING WITH THE MARKETby Carl Swenlin | DecisionPoint.com
When the market changes, we must change our tactics, strategies, and analysis techniques to accommodate the new market conditions. This is not a new idea, but it is one that is not very widely recognized, particularly when applied to the long-term. In recent writings I have emphasized that we are in a bear market, and that we must play by bear market rules. Overbought conditions will usually signal a price tops, and oversold conditions can often see prices slip lower to even more oversold conditions. When making these comments, my focus has been on the cyclical bull and bear markets. What I want to address in this article are the secular forces of which we must be aware.
On the chart below I have identified the five secular trends that have occurred in the last 80-plus years. First is the 1929-1932 Bear Market, which, although it was short, saw the market decline 90%. Next was a secular bull market that lasted from 1932 to 1966, which overlaps with the consolidation of the 1960s an 1970s. In the early 1980s another secular bull market began which peaked in 2000 (basis the S&P 500). Finally, we seem to have entered another consolidation phase that could last another 10 to 15 years.
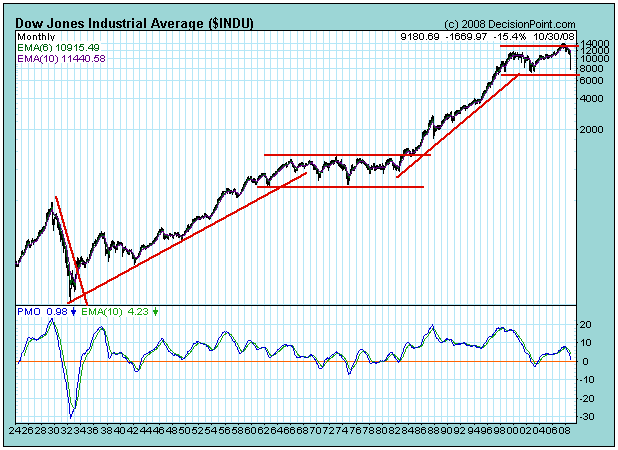
I began my market studies in the early 1980s, before the big bull market took off, and I learned from the guys who learned all they knew from the market action of the 1960s and 1970s. Applying those rules to the new bull market was confusing, frustrating, and unprofitable. While I didn't participate in those markets, it is easy to imagine the bewilderment of those who, educated in the bull market of the 1920s, took the elevator all the way down to the basement starting in 1929.
The long bull market after the 1932 bottom was missed by most of those traumatized by the crash, but it trained a whole new group of analysts who learned that the market always goes up . . . until everything they knew was proven wrong by a 20-year consolidation. Finally, the battle cry of the 1980s and 1990s bull, "this time it's different," was learned well by those who ultimately ate the 50% decline of 2000-2002.
Unfortunately, it takes time to unlearn the lessons of the heady 1980s and 1990s, and we can still observe people using bogus valuation models that only work in bull markets. We still see people trying to pick bottoms, and we still see people who think that a stock is under valued because it is down 70%. By the time this current secular market phase is over, people will have learned all new rules, that will not apply to the next 20 years.
Whether or not I have correctly identified the current secular market phase as a consolidation remains to be seen, but I am certain that we are no longer operating on the rules of the last secular bull market. Previously, I've mentioned a favorite indicator of mine - The Bowley Trend. The Bowley Trend is an analysis of stock market history, dating back to 1950 on the S&P 500 and 1971 on the NASDAQ. It identifies discernible bullish and bearish trends that have emerged over time and provides additional clues as to the direction of equity prices. I use The Bowley Trend to corroborate technical signals.
I mentioned in a July article the 2nd worst historical week of the year. We just experienced a major league beating during the absolute worst period. The most interesting aspect of October is that the worst historical period is followed immediately by the best historical period - amazingly, the bearish switch is turned off and the bullish switch is turned on, literally overnight. Consider the following annualized returns since 1971 on the NASDAQ:
October 22: 15 up days, 11 down days, annualized return -64.98%
October 23: 8 up days, 16 down days, annualized return -89.82%
October 24: 11 up days, 16 down days, annualized return -66.26%
October 25: 9 up days, 19 down days, annualized return -66.85%
October 26: 12 up days, 15 down days, annualized return -110.15%
October 27: 11 up days, 15 down days, annualized return -110.28%
Pretty darn bearish, I'd say. Now consider these bullish numbers from a period that immediately follows the above bearish period:
October 28: 17 up days, 8 down days, annualized return +132.02%
October 29: 16 up days, 10 down days, annualized return +68.14%
October 30: 13 up days, 13 down days, annualized return +46.85%
October 31: 17 up days, 9 down days, annualized return +105.77%
November 1: 16 up days, 12 down days, annualized return +62.41%
November 2: 16 up days, 9 down days, annualized return +144.07%
November 3: 16 up days, 10 down days, annualized return +84.13%
November 4: 15 up days, 9 down days, annualized return +54.94%
November 5: 21 up days, 5 down days, annualized return +153.46%
November 6: 15 up days, 11 down days, annualized return +43.91%
Quite a reversal, huh? This historical tendency was a contributing factor for Invested Central turning bullish on Monday, October 27th. The Bowley Trend shorts indices during bearish historical periods, goes long indices during historical bullish periods and remains 100% in cash during neutral periods - neutral periods are defined as periods where there are no discernible trends. During October alone, The Bowley Trend posted an incredible 27.44% return, over 45 percentage points higher than the actual negative return of 17.73%. Perfectly on cue, the major indices reversed course at the close on October 27th. Folks, I don't make this stuff up, I just report the facts. It is periods like these that has enabled The Bowley Trend to nearly triple the "buy and hold" returns of the NASDAQ since 1971. And it's as simple as following a calendar - the dates do not change. It's also why we provide this indicator to our members each day, it's that important.
Technically, the market is recovery mode. We've got a long way to go and the depths of this recession will be great. I've identified near-term support and resistance for the Dow Jones on the following chart:
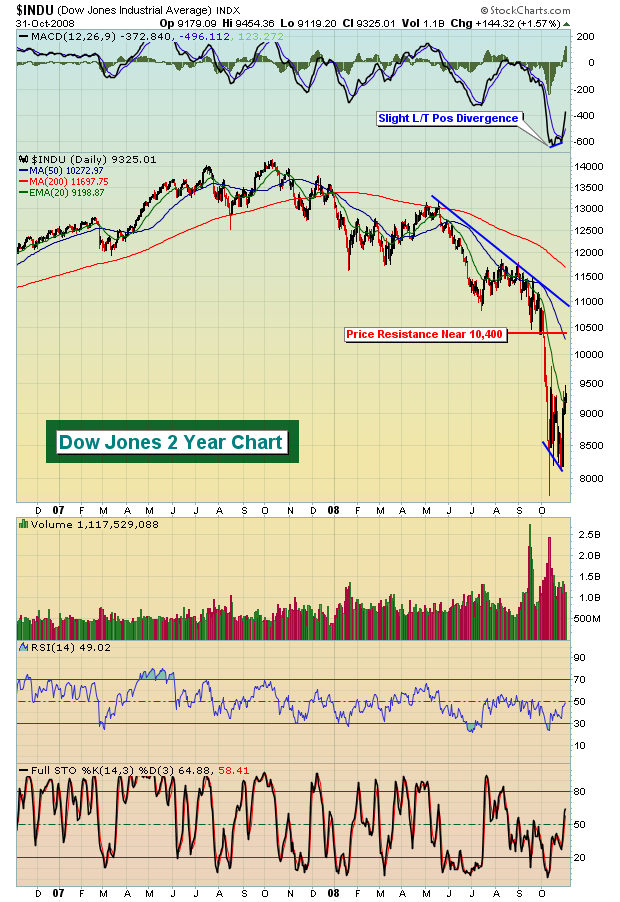
From the above chart, I've identified a key price resistance level on the Dow Jones near 10,400. I believe the current range on the Dow is from 7800-10400 and that's where we'll trade. Should the Dow approach that resistance on lessening volume, be very cautious, and possibly consider shorting if you have a propensity to short. The volatility index, or VIX, is finally taking a breather. Take a look at the two VIX charts below. The first shows where we were in early September and my analysis then vs. where the VIX stands now and what it's signaling.
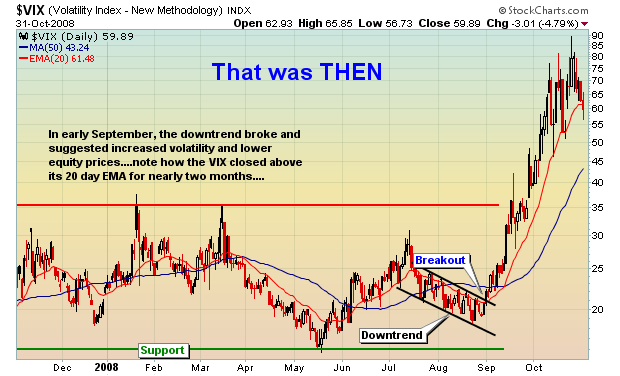
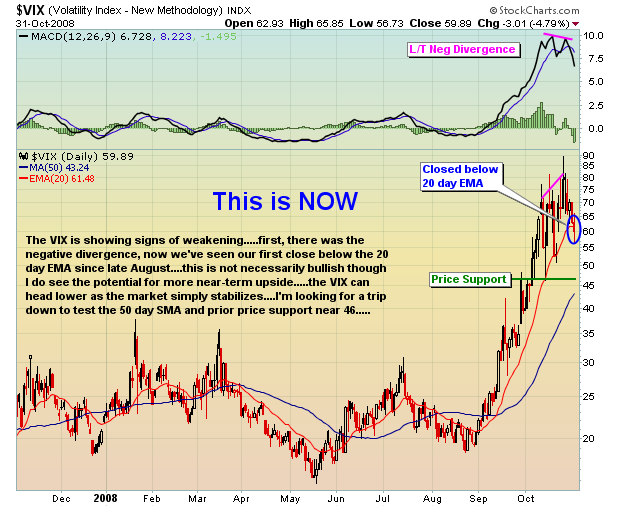
Expect volatility to remain high, but lessening from the ridiculous levels over the past several weeks. Traders will need to remain on their toes, capturing profits when available and keeping appropriate stops in place to avoid big losses.
Happy trading!
Join Tom and the Invested Central team at www.investedcentral.com. Invested Central provides daily market guidance, intraday stock alerts, annotated stock setups, LIVE member chat sessions, and much, much more. WILL OIL SERVICES RETEST RECENT LOWS?by Richard Rhodes | The Rhodes Report
The world stock markets remain rather "volatile" as the credit crisis
continues to unfold, while this volatility pendulum continues to
create some very unique and interesting value propositions we haven't
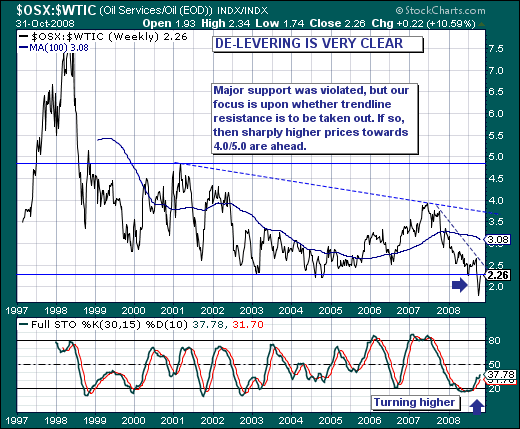
seen in quite some time. Our focus at present is the relative
relationship of the Oil Service Index (OSX) to Crude Oil futures; and
the fact that this relative ratio is just off its lowest point in over
a decade - having fallen from its high above 8.0 in 1998 to its 2008
low near 1.70. The current course of de-levering by the world's hedge
funds has pushed this ratio from 4.0 to its recent low near 1.70, with
last week's surge higher putting overhead trendline resistance into
view in terms of a bullish breakout.
We find this bullish setup interesting from the perspective that
perhaps oil service shares may have forged their bottom given last
week's reversal from major weekly/monthly support levels; however, we
do expect oil service shares to at least retest their recent lows as
our forecast for crude oil futures stands at $39-$40...down another
$25-$30 from current levels. We would be remiss if we didn't believe
that oil service shares would falter in tandem with the price of crude
oil.
Having said this, our favorite choices on a retest are Transocean
Offshore (RIG), Schlumberger (SLB), Weatherford Int'l (WFT) and
National Oilwell Varco (HOV). |
|
|
|
|
|
|
|
|
|
|
|
|
|
|