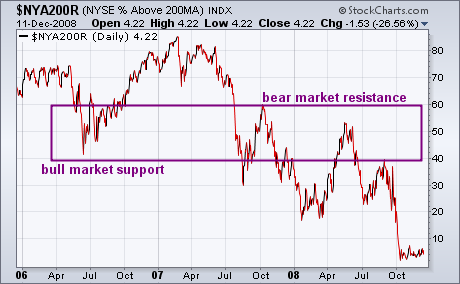
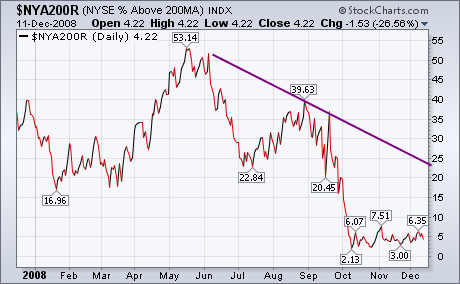
A reliable measure of the market's strength or weakness can be found in the % of NYSE stocks trading above their 200-day averages. That's because 200-day averages are used to measure a market's long-term trend. [A 50-day line measures short- and intermediate- market trends]. Chart 1 shows the indicator since the start of 2006. The sharp drop during the second half of 2007 was one of the bearish signs that warned of a coming bear market. During bull market corrections, the indicator will often pullback into the 40-50% region. The April 2006 bull market correction bounced from 40%. Drops below 40% signal the start of a bear market which occurred during the second half of 2007. Bear market bounces can rise into the 50-60% region. The April/May bounce rose to 53% before turning back down again. The August bounce failed at 40%. A reading above 60% is normally needed to signal a new bull market. Chart 2 shows the trend during 2008 which is still very low 4%. That means that 96% of NYSE stocks are trading below their 200-day lines. While that historically low reading reflects a deeply oversold market, it doesn't show any sign of turning higher. Remember that the stock market is a market of stocks. The market can't be expected to rise much when the overwhelming majority of its stocks are still in major downtrends.
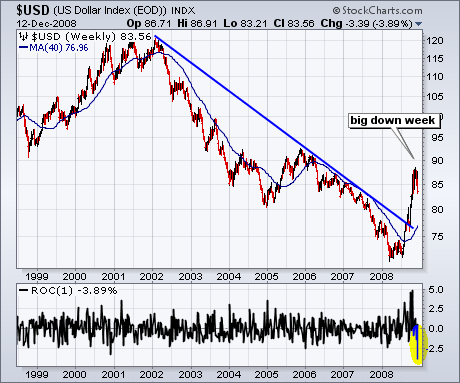
After surging from the low 70s to the upper 80s, the U.S. Dollar Index ($USD) experienced its sharpest decline in years. In fact, this week's decline was the sharpest in over 10 years. The bottom indicator window shows the 1-week Rate-of-Change dipping to -3.89% this week. While this may seem like a trend changing event, keep in mind that the Dollar was quite overbought after the prior advance. Some sort of correction is normal and the index could very well retrace 50% of the prior advance.
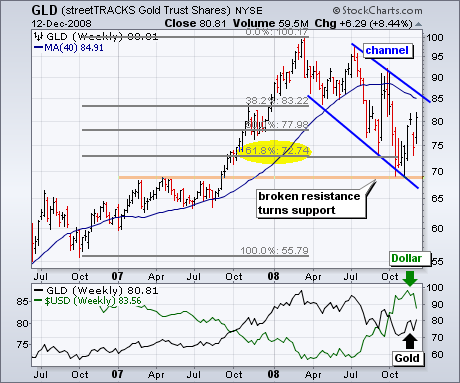
Weakness in the greenback sparked a rally in gold this week as the streetTRACKS Gold ETF (GLD) gained over 8%. The surge off support looks impressive, but GLD remains in a falling price channel for the year. This pattern, however, could be bullish because it looks like a massive flag. Flags are corrective patterns that form after a big advance. A break above the 40-week moving average and upper trendline would signal a continuation of the prior advance (55-100).
There is also a video version of the this analysis available at TDTrader.com - Click Here.
Last week we looked at a descending wedge pattern on the S&P 500 chart that could have sparked a rally had it resolved to the upside. Prices actually did break upward, but volume was poor, and the up move stalled immediately. Now there is an ascending wedge pattern inside a declining trend channel. The technical expectation is for the wedge to resolve to the downside, but I should emphasize that it would only have short-term implications.
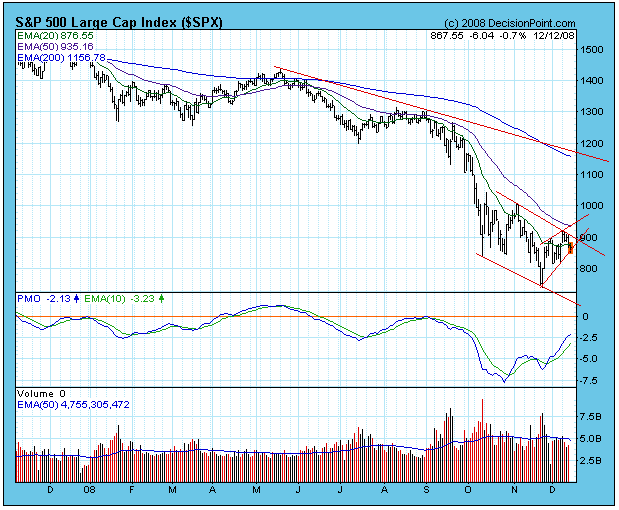
I am becoming more concerned with the medium-term prospects for the stock market. In late-October the market became extremely oversold by virtually every measure. This was a signal for us to start looking for an important rally. Since then, the oversold readings have been getting worked off as the market has been grinding sideways and lower. As you can see on the chart below, three of our medium-term indicators for price, breadth, and volume have been moving up and are relatively overbought (relative to their recent trading ranges).
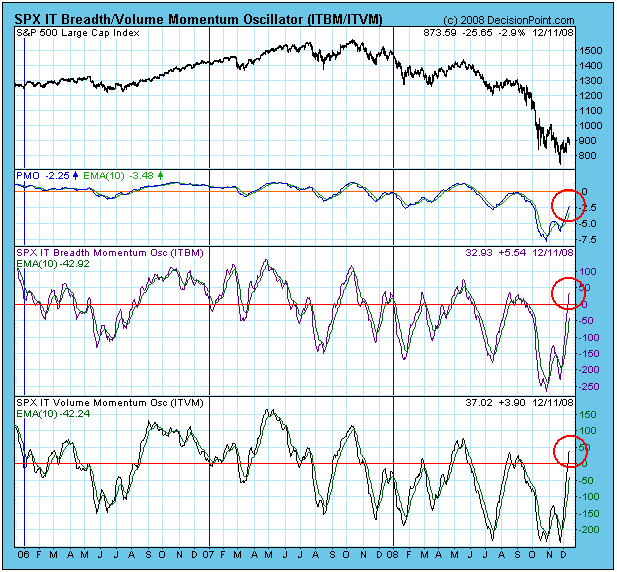
On the chart of our OBV suite of indicators below, note that the medium-term VTO (bottom panel) is at overbought levels. The short-term CVI and STVO have also peaked in overbought territory.

Bottom Line: There has been a small rally out of the November lows, but volume has been weak. Deeply oversold readings have so far failed to deliver a rally of the strength and duration we would normally expect, and, with internals now becoming overbought, time is running out. The problem, I suspect, is that the only buyers are nervous short sellers. Once the shorts have covered, new buyers needed to continue the rally fail to materialize because nobody wants to buy this market.
I knew eventually we'd get a rally with legs. The recent long-term positive divergences across our major indices suggested a 50 day SMA test was on the horizon and that's exactly what we saw this past week. Key indices hit resistance and, not surprisingly, backed away on the first attempt. The bears have been in the drivers seat for the last few months. They were not going to be taken down without a fight. The battle was waged and the bears were victorious - for now.
The market has stabilized somewhat and that's a positive. I wouldn't go so far as to say it's stable, just that it's in the process of stabilizing. Thursday afternoon's selloff occurred with the VIX barely budging higher. That's a critical sign that the fear and panic that ruled the market and ruined portfolios is not a major factor currently. Resiliency is a word often associated with the market now. Horrible news is being routinely ignored. The Employment report last Friday was worse than anyone could have predicted. Yet after a quick morning selloff, the major indices rallied. On Thursday evening, the Senate rejected the House's proposal on a $14 billion bailout package and futures were bleak. Asian markets tumbled overnight and given the late day selloff on Thursday, US investors were worried that another steep drop was upon us. But futures improved into the open and the major indices mostly rallied throughout the day, finishing in positive territory and near the highs of the day. It's that old adage, "sell on rumor, buy on news".
I am beginning to rely less on sentiment indicators as the market appears to be moving away from the emotional level of trading that we saw for many weeks. I expect to see more back and forth action once a range is established. That should set up for very profitable trades using momentum oscillators like stochastics and RSI. During the recent downtrend, the daily RSI has remained primarily below 50. If conditions are truly changing, we should see that oscillator begin to move back and forth between the key levels at 30 and 70. In sideways, consolidating markets, the stochastics and RSI oscillators can prove to be the most useful indicators for entry and exit points.
Technicals precede fundamentals. They always have and they always will. If you can follow the price action, you can trade the market. Will the recent bullishness last? Yes, it's quite possible. In fact, I'm watching for the highs on this current leg up to define our trading range over the next several months. While January 2008 was horrific for equities, the December-January timeframe is historically quite bullish. Financials are trying to repair themselves technically, but hurdles remain. As you can see from the chart of the XLF below, it's attempting to ascend past key short-term price and moving average resistance as reflected below:
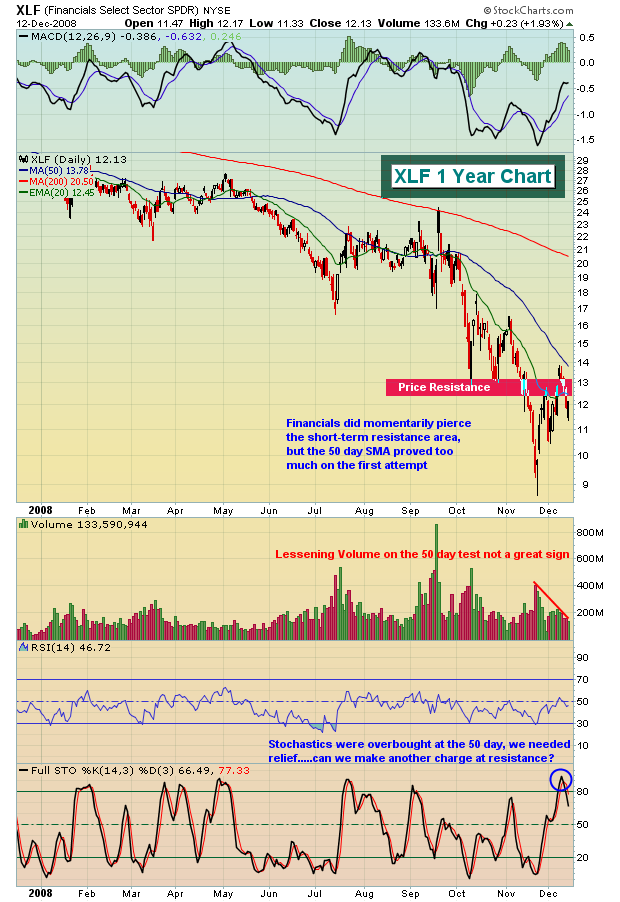
A move past key resistance will open the door to higher equity prices overall. Similarly, the SOX is also knocking at resistance's door as shown below in Chart 2:
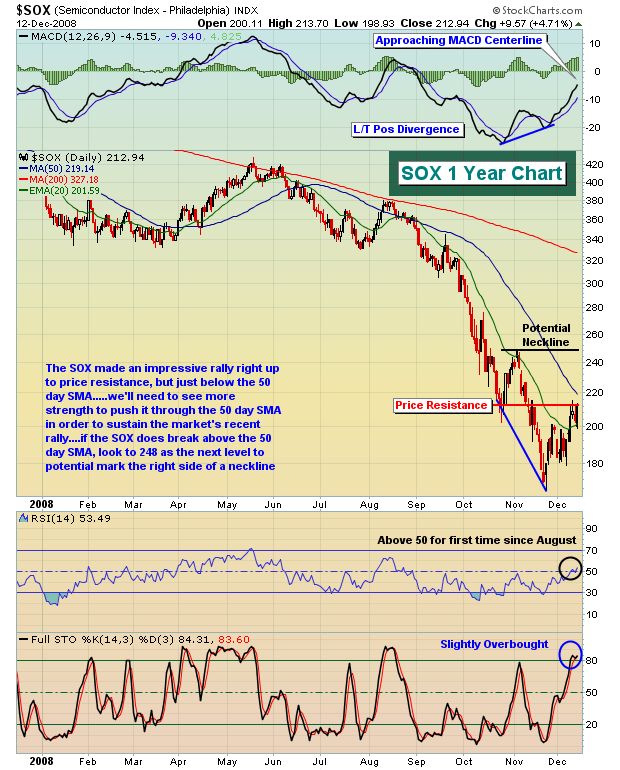
These are two influential groups that will most likely need to participate in further strength in equities. Without them, this attempt could be futile.
I want to wish everyone a relaxing holiday season and a happy new year!
Happy trading!
As we approach the end of the year, we find world stock markets
attempting to trade a bit higher, although volatility remains quite high, but off it's worst high levels. However, we believe it shall not be low for very long; hence our propensity is to use this rally attempt to put put back on several short positions. From our trading perspective, we believe the energy sector have quite a bit of downside remaining...even thought the sector has been decimated. Our reasoning: lower crude oil prices on the order of $30-$36/barrel. This range is a bit wider than we have previously stated, and it incorporates last
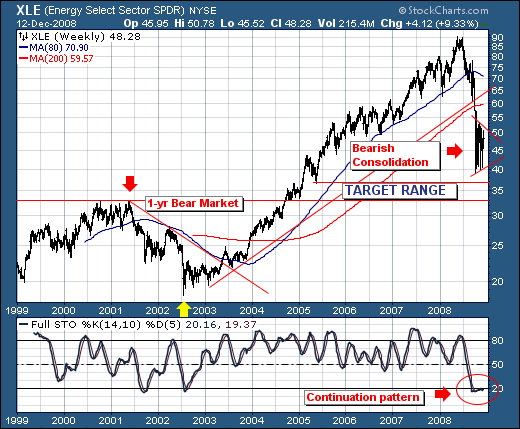
week's Goldman Sachs reversal from $200/barrel to $30/barrel in the next 3-months due to the widening of the "super contango." Our reading of the technicals behind the S&P Energy ETF (XLE) seem to bear this out...no pun intended!
Looking at the XLE weekly chart, we find prices fell off a cliff much like all other sectors - breaking down through its bull market trendline and its 70-week and 200-week moving averages. Obviously this is bearish stuff, with the trend remaining lower. What our interest is in at present is the manner in which prices are consolidating in sideways fashion in conjunction with the inability of the 14-week stochastic to move higher out of oversold territory. This argues rather strongly we think for a resumption of the downtrend in the very
near future that should coincide with crude oil prices falling towards our above-stated range. Our target is $33-to$36, which is about -25% off current levels. The question is one of timing.
