This is the second part of a series of articles about Technical
Analysis from a new course we're developing. If you are new to
charting, these articles will give you the "big picture" behind the
charts on our site. if you are an "old hand", these articles will help
ensure you haven't "strayed too far" from the basics. Enjoy!
(Click here to see the first part of this series.)
The Value of Technical Analysis
The reason technical analysis has value is that directional price moves are often sustained for a period of time allowing analysts to detect and profit from the change in price. Even though a technical analyst has many math-based tools to analyze price and volume movement, the process is ultimately an art in the study of human behavior.
Just as the meteorologist can never guarantee a weather forecast, a technical analyst can never be perfectly certain of future price movements since human behavior is involved.
Figuring out the what and whenâ¦
All investors are faced with three basic questions with their investments. What to invest in, when to buy and when to sell. Technical analysis provides a framework for investors to methodically select equities and pick times to buy and sell. Emotion, the investorâs nemesis, is greatly reduced in these decisions since the investor can develop a list of âwhat and whenâ rules to follow. Rather than âbuying and hoping for the bestâ, technical analysts always know how much risk they are taking and know when to âget out while the getting is goodâ.
Only price and volume onlyâ¦
Only historical price and volume data is used for technical analysis. The underlying premise of technical analysis is that all known information such as what a company does, its financial results, analystâs ratings, management performance, politics, news, etc. are reflected in the historical price and volume data. This is a powerful concept since it is impossible to gage how these factors may influence future price separately.
It is important to understand technical analysis can only be used to determine the likely direction of future prices. It cannot anticipate news events or how investors will respond to them.
The Goal of Technical Analysis
The graph above is a historical price chart for the company Analog Devices, Inc., ticker symbol ADI. The line represents the price of ADI over a period of a year. The price chart illustrates how prices can move up, down or sideways for months at a time. Technical analysis uses methodologies to help indicate when prices are beginning to change direction. The goal of a technical analyst is to buy an equity when the price chart indicates prices are beginning to move up and then sell when the price chart indicates prices are beginning to move sideways or down.
Why Technical Analysis Works
Technical analysis works because price and volume often reveal the collective psychology (the âfear/greed balanceâ) of a marketâs participants. Technical charts can reveal changes in the fear/greed balance soon after those changes occur and that provides opportunities for profitable trades. Technical analysts work to identify charts where the fear/greed balance has recently changed in a predictable manner. They then place trades to try and profit from that change. Once they have bought a stock, technical analysts monitor price and volume for sell signals.
Done correctly, trades based on technical analysis carry a higher than average chance of success but disciplined money management techniques must still be used to guard against unforeseen price movements.
Misuse of Technical Analysis
While the basics of technical analysis are easy to learn, applying them correctly and successfully isnât easy. Because of this many people have lost money using technical analysis techniques and then concluded that chart analysis has no value. In addition, unfortunately, many unsuspecting investors have purchased technical âsystemsâ that promise outlandish returns for little effort. By the time the buyer figures out that the system doesnât work, their money is long gone.
Technical analysis is just like any other money making occupation â it takes time and energy and it involves risk. Anybody who says otherwise shouldnât be trusted. Here are ways technical analysis has been misused in the past:
The Holy Grail mentalityâ¦
One of the most common misconceptions about technical analysis is that a trading system (a set of buy and sell rules) can be devised that provides consistent profits with little to no risk.
There are several reasons that a âperfect systemâ cannot be sustained. Firstly, the market is made up of people with free will and guided by fear and greed. A perfect system requires prices to consistently move in predictable patterns. This will never be possible when people are involved. Secondly, many financial institutions monitor the market for patterns of systematic trading. Once detected, the financial institution can take advantage of the system (investing with or against it) which eventually compromises and defeats the âperfect systemâ. And finally, what motivation could someone have to share a âperfect systemâ at any price? Such a system would be invaluable to one person but worthless (for the second reason) if too many people or even one institution discovered it.
Just tell me what to buyâ¦
Investment charlatans and gurus have always been offering advice how to profit in the market. These are the people who take financial advantage of new and uninformed investors by promising quick and profitable investment success. Claims of ultra-high rates of return or knowledge of future events for substantial fees are the best ways to identify such schemers.
Although a real guru is a spiritual guide or teacher, the title âMarket Guruâ is gladly accepted by advisors who have developed notoriety with fortuitous calls of major market changes or unusual approaches to investing. Todayâs TV media and Internet enthrone new market gurus on a regular basis. There are precious few true market gurus like Warren Buffet who have proven their market savvy over decades. Most market gurus can only provide profitable guidance as long as the market is favoring their investment philosophy. As the market changes, new market gurus will emerge as their philosophiesâ agree with the new market dynamics.
Technical Analysis lets me control the marketâ¦
While few people consciously believe that they can control a stockâs price directly, subconsciously, chart analysis can give new investors a false sense of control which will cause them to lose objectivity. âMy stock just broke below my trendline today, but it will come back tomorrow since that is a really good trendline!â
The opposite response is just as damaging â âMy stock broke my trendline! T/A is worthless!â Both responses are driven by emotion, something that technical analysis strives to eliminate.
Next time, we'll take a critical look at the assumptions that Technical Analysis makes about the markets.
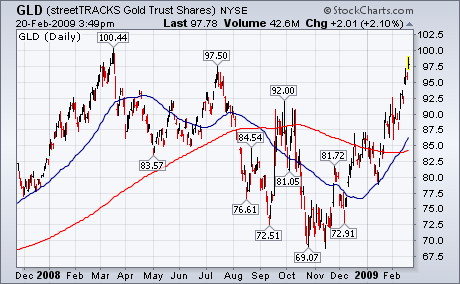
GOLD TOUCHES $1000 FOR FIRST TIME IN A YEAR... A number of
financial markets are testing important chart points. Let's start with
gold. Bullion touched $1,000 today for the first time since last March.
Chart 1 shows the streetTracks Gold Trust (GLD)
very close to touching its March 2008 high at 100. On a short-term
basis, however, the price of gold looks overbought. Some profit-taking
from this level wouldn't be surprising. If that's true, some
counter-trend moves may be seen in some other markets. The dollar may
have also started one.
DOLLARS DIPS AS EURO BOUNCES ...
The U.S. Dollar has been rising along with gold since December. Chart 2, however, shows the
Power Shares DB US Dollar Index Fund (UUP) dropping today from chart resistance near its November high. Chart 3 shows the
Euro
bouncing off chart support along its November low. That suggests that
some "short-term" market dynamics might be changing. A weaker dollar
might contribute to some profit-taking in gold and buying in some
oversold commodities. A bouncing Euro might suggest that the recent
selloff in stocks is overdone as well. I've shown before that stocks
have been trading in tandem with the Euro since midyear and opposite
the dollar.
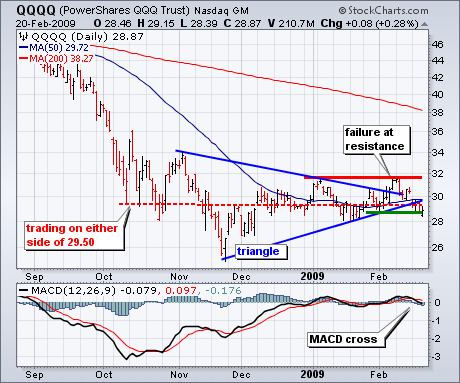
Two weeks ago I featured the Nasdaq 100 ETF (QQQQ) with a triangle breakout, strong OBV and relative strength. The ETF surged to resistance from the early January high, but ultimately failed to break above this key level. With a sharp decline over the last eight trading days, the trading bias has quickly shifted back to the bears. The failure at resistance, gap down, trendline break and MACD crossover are all bearish until proven otherwise. At the very least, QQQQ needs to fill Tuesday's gap to merit a reassessment.

The second chart shows the Nasdaq with similar characteristics. There are, however, two notable differences. While QQQQ reached its early January high and broke the triangle trendline, the Nasdaq fell short of this high and did not break the triangle trendline. The Nasdaq is a much broader index than
the Nasdaq 100 (QQQQ) and shows relative weakness. With a gap down, trendline break and MACD crossover, the bulk of the evidence is currently bearish for the Nasdaq as well. Before getting too bearish, notice that trading has been extremely choppy since October. Both the Nasdaq and QQQQ have traded on either side of their October lows the last four months. While the bias is currently bearish, the seas remain treacherous for both bulls and bears.
There is also a video version of the this analysis available at TDTrader.com -
Click Here.
The long-awaited retest of the November lows has finally arrived. The
S&P 500 is still slightly above that support, but the Dow has
penetrated it. Even though every rally since November has been greeted
with intense hope of a new advance that would end the bear market, the
market gradually rolled over into a declining trend after the January
top.
The November bottom was also a 9-Month Cycle bottom. In a bull
market we would expect the market to rally for several months. The fact
that the rally failed so quickly, is a very bearish sign.
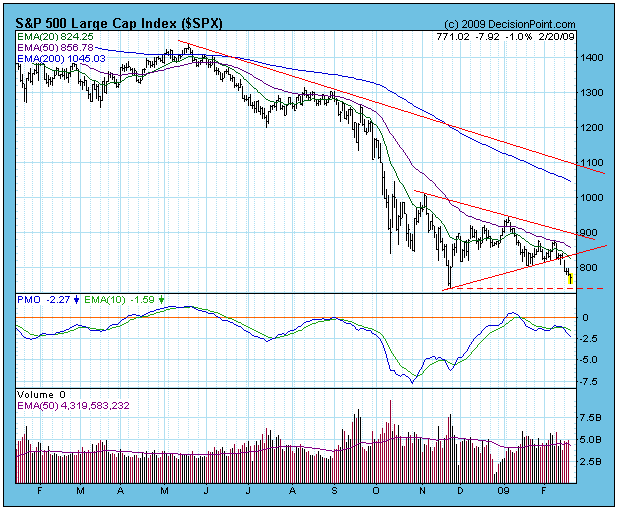
The longer-term view shows that the 2002 bear market lows are also
being tested again, so the market is at a very critical point. Many
people who are still holding equities (at a 50% loss) are counting on
being bailed out by a big rally. If prices fall significantly below
long-term support, we are likely to see another selling stampede.
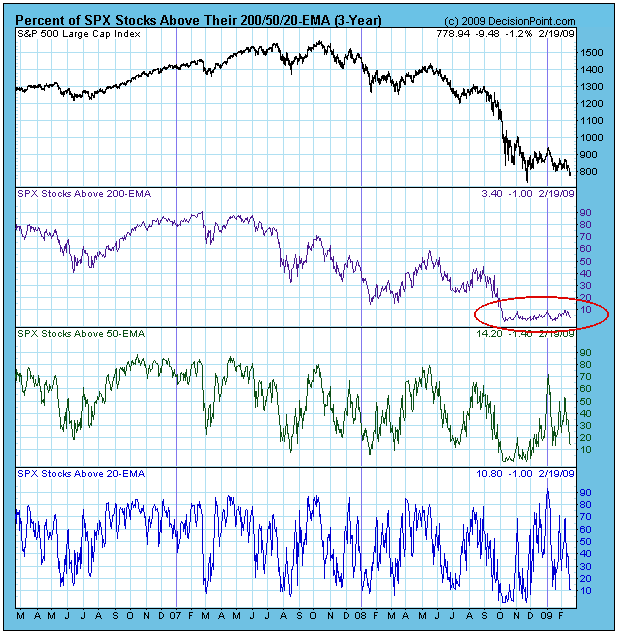
The long-term condition of the market is deeply oversold, as
demonstrated by the Percent of Stocks Above Their 200-EMA. This
indicator has never been at these low levels for such an extended
period of time. Normally, a rally is in the cards as soon as these
levels are reached, but the market is flat on its back, and it is hard
to say when it will recover. It is important not to get too anxious to
get back in. We are in a bear market, and negative outcomes are much
more likely than positive ones.
Also, remember that oversold conditions in a bear market are
extremely dangerous. If the current support zone fails, a market crash
could quickly follow.
The medium-term condition of the market is neutral. Note that the ITBM
and ITVM charts below are mid-range and falling. This is not a level
from which we would expect a powerful rally to be launched.
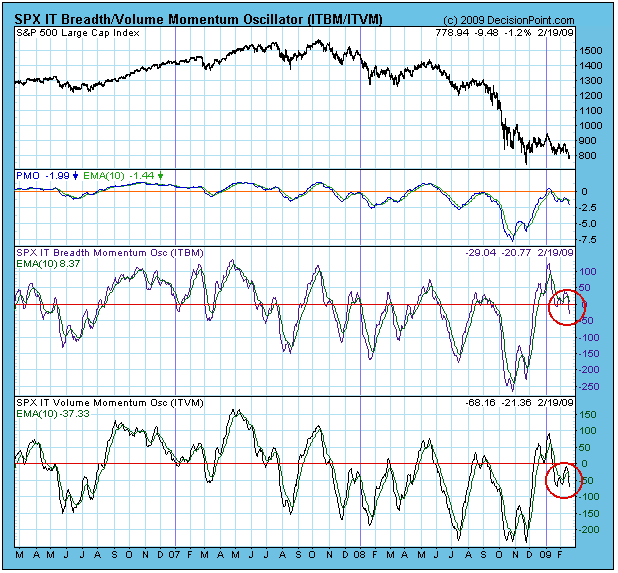
Bottom Line: The market is in the midst of a retest of very important
support. Since we are in a bear market, I expect that the support will
fail.
Technical analysis is a windsock, not a crystal ball. Be prepared to adjust your tactics and strategy if conditions change.
I receive a lot of questions regarding the "ultra" shares and "ultrashort" shares and how to effectively trade them. In particular, there are always questions asking why those "juiced" ETF returns don't correspond to the indices they're supposed to track over time. Let me give you an example. Take a look at the two charts below. The first is a five month chart of the Dow Jones U.S. Financial Index ($DJUSFN), while the second reflects the ProShares UltraShort Financial (SKF) during that same timeframe. The SKF is designed to inversely track the $DJUSFN at a 200% clip. In order to benefit from weakness in financials, you could purchase the SKF and profit to the tune of 200% the decline in the index. Just keep in mind that a ride on Space Mountain at DisneyWorld will seem like a stroll in the park compared to an investment in the SKF, however. :-)
On the line charts (line charts show only closing prices) below, take a look at where the SKF closed on February 20th vs. January 20th vs. November 20th. It was lower each time. But how can that be if the $DJUSFN is lower each time? If the index is putting in lower lows, shouldn't the ultrashort SKF be putting in higher highs? The answer is no - check this out:
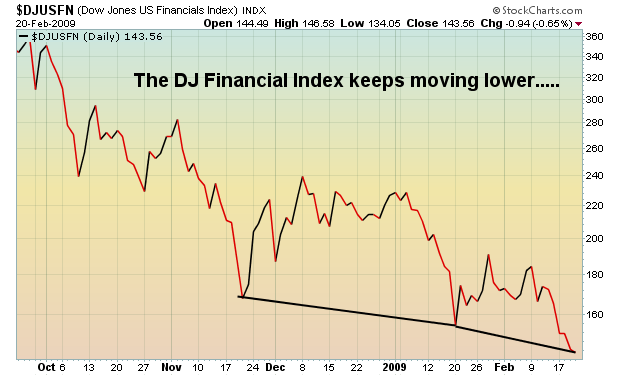
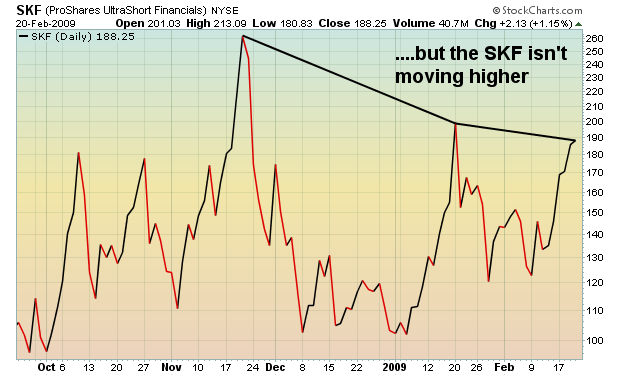
On November 20th, the $DJUSFN closed at 167.95 and the SKF closed at 262.45. On February 20th, the $DJUSFN closed at 143.56 while the SKF closed at 188.25. So over the last three months, the $DJUSFN fell 14.52%. Since the SKF is designed to inversely double the returns of the $DJUSFN, one would reasonably expect to see the SKF closing roughly 29% higher than it did in November. Instead, the SKF has FALLEN from 262.45 to 188.25, or 28.27%. It should have GAINED 29%, but instead it DECLINED 28%. What gives? Well, so long as the index moves in one direction or the other, juiced ETFs do a fine job of following at a 200% clip - generally speaking. However, after several days of ups and downs in the index, the juiced ETFs lose their value and cannot fulfill that 200% promise. For a fairly simple explanation, go to our website at www.investedcentral.com and click on "Trading the Juiced ETFs". It's roughly a 15 minute demonstration showing why the juiced ETFs cannot keep pace over time. If you like to trade juiced ETFs, it will be well worth the time.
Here's the bottom line. Avoid the temptation to trade the juiced ETFs based on its technicals. I've come to realize that the technicals associated with those ETFs are irrelevant. Instead, determine your entry and exit points based solely on the technicals of the underlying index that the ETF is designed to track. From that index, determine your target and apply those measurements to the juiced ETF.
Happy trading!
In our last commentary, we noted that the S&P Energy ETF (XLE) was in the process of forming a bearish consolidation that argues for sharply lower prices. And since then, prices have consolidated further, but
are now poised to breakdown below trendline support and the October-2008 lows. However, this sector remains a favorite of both fundamental and momentum traders as perceived safety plays. However,
we would argue that while they may be so now; they will not be in the future, and in fact - if the market does indeed rally at some point soon - they shall not lead the rally.
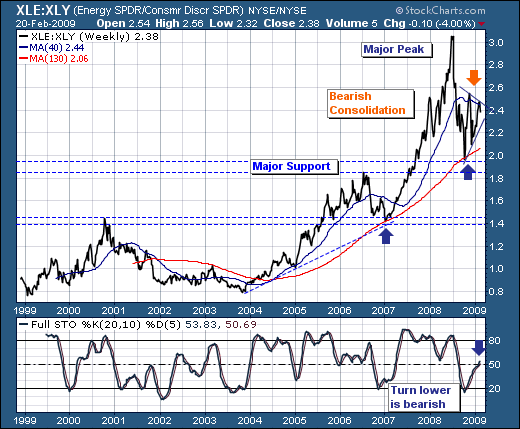
In support of this thesis, we look at the S&P Energy ETF vs the S&P Consumer Discretionary ETF (XLE:XLY). Arguably, in this horrid economy, one would think that you would have to be out of your
collective trading mind to buy anything related to the discretionary stocks. But, the ratio chart shows that XLE has under-performed XLY since June-2008, and we are more interested know in the fact a bearish
consolidation has formed, which would imply the trend that began in June-2008 is about to reassert itself in the weeks ahead. Moreover, we see the very same pattern when we look at XLE vs the S&P 500 Spyder (SPY). This leads us to conclude that XLE is not where one wants to hold long positions; either in bull or bear moves, for it is poised to under-perform rather dramatically - perhaps by as much as 25%
difference if our back of envelope technical measurement target a 1.8 ratio. What one was considered "safety", will soon become a source of funds for more "risky" assets. Be forewarned; be prepared.