TECHNICAL ANALYSIS 101 - PART 4by Chip Anderson | ChartWatchers This is the fourth part of a series of articles about Technical
Analysis from a new course we're developing. If you are new to
charting, these articles will give you the "big picture" behind the
charts on our site. if you are an "old hand", these articles will help
ensure you haven't "strayed too far" from the basics. Enjoy!
(Click here to see the beginning of this series.)
Line Charts
Line charts are created by plotting a line between the closing prices for each period set on the chart. On a daily chart, a line is plotted between the daily closing prices. Line charts are useful to help visualize the direction of prices. The extent of rallies and reactions in trends can also be quickly deduced.
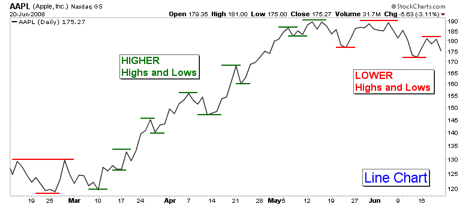
A five month price SharpChart of Apple, Inc. (AAPL) is plotted above in a line format. Higher highs and lows are annotated with green dashes and lower highs and lows with red dashes. Between March and mid-May 2008, the direction of prices is readily apparent with higher highs and lows. After mid-May 2008, prices began to make lower highs and lows.
A line chart is plotted by default when only end-of-day (closing) prices are available for a symbol. Examples of such symbols include all mutual funds and some market indices. However, weekly and monthly price bars can be charted for ticker symbols with only end-of-day (EOD) quotes.
OHLC Charts
Open-High-Low-Close (OHLC) bar charts provide volatility information that line charts lack. The attributes of an OHLC bar are shown below. The chartist can evaluate volatility by the height of the bars and the conviction of the buyers and sellers by the price range between the open and close marks.
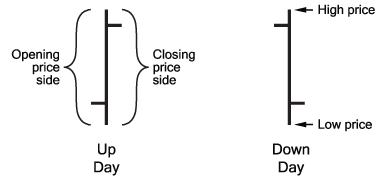
For the left price bar, the CLOSE mark is above the OPEN mark indicating price ended higher for the day, known as an up day. This price bar is considered bullish. Bullish sentiment is present when greed for gain exceeds fear of loss and prices move higher.
With the price bar on the right, the OPEN is higher than the CLOSE indicating price ended lower for the day, known as a down day. This is a bearish price bar. Bearish sentiment is present when fear of loss is greater than greed for gain and prices move lower.
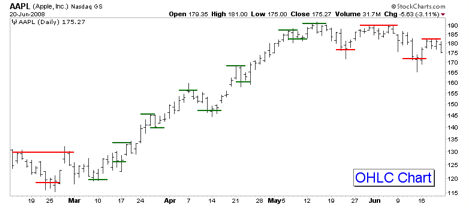
The SharpChart of AAPL above illustrates the OHLC format.
Notice how intraday price swings pass through the red and green reference marks made at the closing price levels on the previous Line chart. This illustrates why line charts are useful for visualizing price direction.
OHLC Bar Colors

When the âColor Pricesâ option is selected on the Chart Attributes workbench, the price bars will be colored black or red, depending on how a price barâs closing price relates to the previous dayâs closing price. If the closing price is higher than the previous dayâs closing price, the price bar will be black. If the closing price is lower than the previous dayâs, the price bar will be red. With this convention, it is possible to have a black price bar with the close being lower than the open.
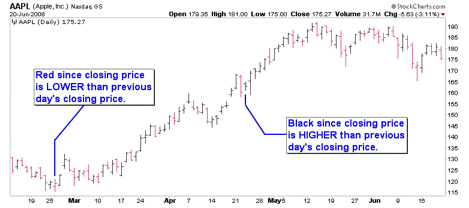
Colored OHLC price bars are shown in the AAPL SharpChart above. As discussed earlier, the color of the price bar is only based on the previous dayâs closing price, not the current dayâs opening price. âUp dayâ and âdown dayâ price bars are usually black and red respectively, but that is not always the case as shown in the chart above.
Next time, we'll get into the specifics of Candlestick charts.
GOLD STOCKS TOP 200-DAY AVERAGEby John Murphy | The Market Message The Fed's midweek surprise announcement that it was buying Treasury
bonds had a fairly predictable ripple effect through the various
financial markets. Naturally, Treasury bond prices jumped and yields
collapsed. The big drop in bond yields pushed the dollar sharply lower
and commodities higher. As Arthur Hill described during the week, gold
experienced an impressive upside reversal and may have reverted back to
an inverse relationship to the dollar. One of the top stock groups on
the week was precious metals. A month ago, I turned cautious on the
short-term outlook for precious metals when the Market Vectors Gold Miners ETF (GDX)
fell back below its 200-day moving average. Chart 1, however, shows the
GDX closing well above that resistance line and on the verge of a new
six-month high. That puts precious metal assets back in the fast lane.
The main reason for the jump in gold and other commodities is the
belief that a weaker dollar resulting from the Fed's printing of so
much money will increase inflation pressures. One way to hedge against
that possibility is to own some precious metal assets. Another way is
to own some TIPS.

SPY HITS RESISTANCEby Arthur Hill | Art's Charts After a sharp advance the last two weeks, SPY hit a classic resistance zone and pulled back over the last two days. Three items confirm resistance in the low 80s. First, broken support around 80-81 turns into resistance. Second, the falling 50-day moving average marks resistance. Third, the advance retraced 50% of the Jan-Mar decline, which is typical for a retracement.
In addition to resistance, there were also signs that SPY was overbought. The bottom indicator shows the Commodity Channel Index (CCI) moving above 100 for the third time this year. The first two overbought readings marked the early January peak and the early February peak. Also notice that the 7-day Rate-of-Change surged above 17%. This was the biggest 7-day surge in over six months. While such a sharp advance shows strength, it also reflects overbought conditions.
Overbought conditions can be alleviated with a correction or consolidation. SPY could retrace 38-62% of the prior surge with a pullback or we could see a choppy trading range evolve to consolidate the gains. Either way, it looks like the market is ready for a rest after such impressive gains.
There is also a video version of the this analysis available at TDTrader.com - Click Here.
SHORT-TERM TOPby Carl Swenlin | DecisionPoint.com
Quite a few years ago I used to write a daily newsletter, but I decided
to give it up because it got tiresome trying to invent new ways to say
the same thing over and over. More important, having to form an opinion
on the market every single day, especially during volatile times as we
have been experiencing, can build a of stress. Also, since I am
primarily focused on the intermediate-term and long-term time frames,
it can be counter productive to put too much effort into short-term
analysis.
This week was especially challenging due to the Fed's
announcement, which caused big rallies in stocks, bonds, and
commodities, and a big decline in the dollar. Also, a number of market
and sector indexes switched to buy signals. (Standby for more whipsaw.)
The question remains as to whether the Fed's announcement will have a
lasting effect, or if it will prove to be another flash in the pan.
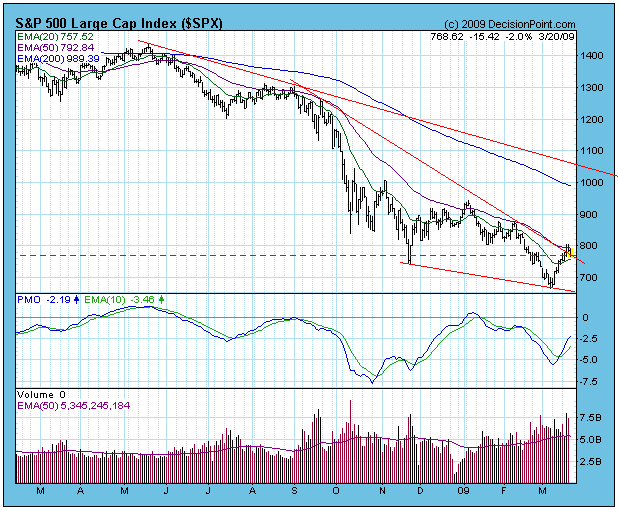
On our first chart we can see that prices moved slightly above
important resistance levels, but they have not made a clear breakout.
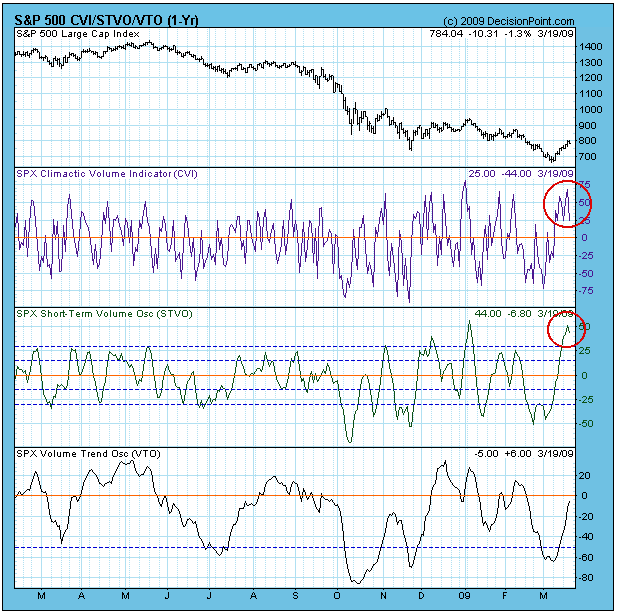
The next issue is that the market is short-term overbought. The
Climactic Volume Indicator (CVI) is extremely overbought, as is the
Short-Term Volume Oscillator (STVO), which hit its second highest level
ever (the highest was in January). Since we are still in a bear market,
chances are very high that the market has hit a short-term top, and
that a short-term correction is under way.
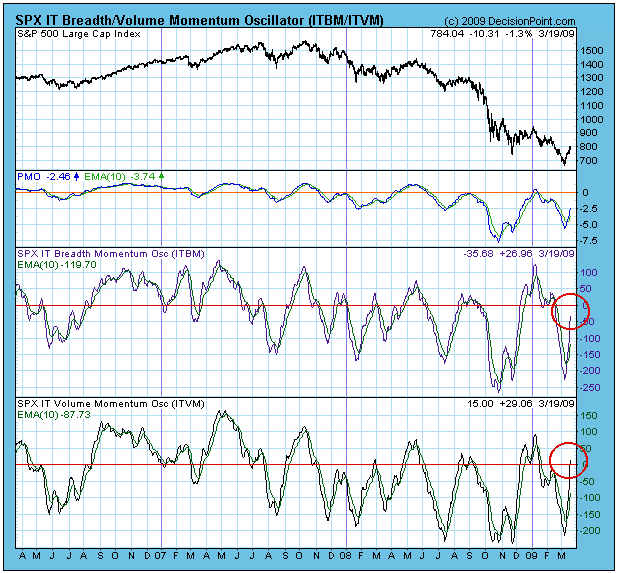
On an intermediate-term basis, internal conditions are neutral, as
shown by our intermediate-term breadth and volume indicators. This
allows for a short correction and the resumption of the up trend;
however, bear market conditions demand that we consider that a more
negative outcome is possible.
Bottom Line: The surge in prices this week has given bulls some encouragement, but my overall expectations remain bearish.
LIGHT AT THE END OF THE TUNNEL?by Tom Bowley | InvestEd Central The market performance the last two weeks was very impressive. Was it simply a sequel to the bounces we saw in October and November? That is certainly a possibility, but we saw a few sparks in this rally. For instance, the volume that exploded in financials must be respected. Perhaps more important, however, was the relative breakout in financials as shown below:
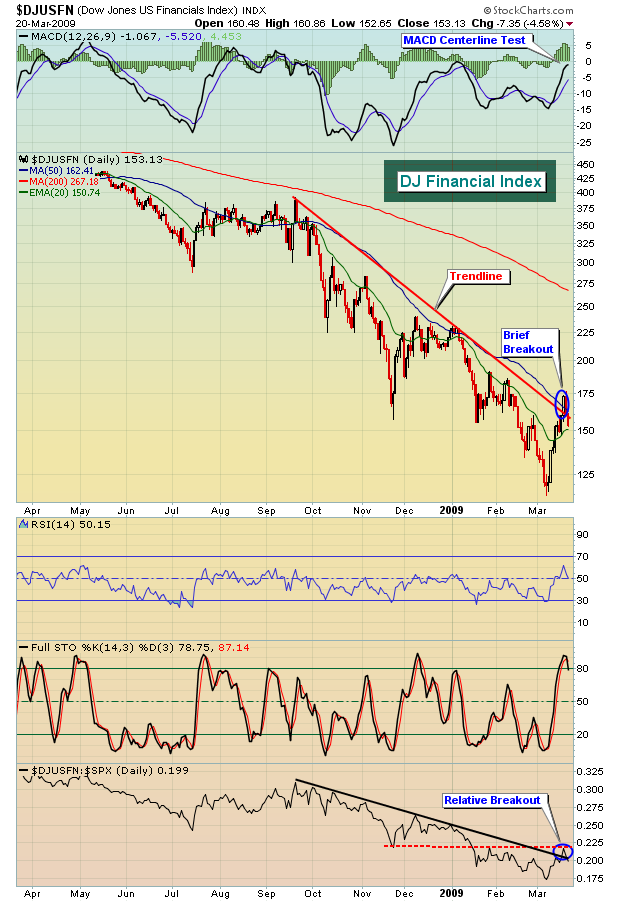
On the surface, the annihilation of financials on Thursday and Friday seemed to potentially crash the party. I'd like to point out, however, that option expiration likely played a significant role there. Let me give you a perfect example - Bank of America (BAC). At Thursday's early morning high, BAC traded at 8.57. There were hundreds of thousands of in-the-money calls ranging from strike prices at $3 all the way up to $8. There were nearly ZERO in-the-money put options. That left BAC quite vulnerable to downside action on Thursday and Friday and that's exactly what we saw - downside action. BAC fell nearly 30% from Thursday morning's high to Friday's close, erasing $MILLIONS in net call premium.
Use this as a lesson. If you're considering buying a stock during options expiration week, check out the underlying option activity. Specifically, look to see how many in-the-money calls vs. in-the-money puts there are before taking a position. More often than not, it will save you or make you money.
It was probably more than coincidental that Citigroup (C) didn't participate in Friday's financial selloff, instead gaining two pennies. Max pain (the price at which in-the-money calls equal in-the-money puts) was situated between $2.50 and $3.00 and there were a TON of in-the-money calls at $2.50 to offset in-the-money puts at higher strike prices. So it closed above the $2.50 level. Coincidence? You be the judge.
In addition to financials beginning to show relative strength, semiconductors also joined the fray. In fact, we've seen semiconductors outperforming the S&P 500 since early December. Check out the chart below:
Financials and technology (especially semiconductors) are two key components in any new bull market emerging. Early signs are pointing to a possible reversal in market strategy. For the last several months, it's been clear that the bear market was raging on. While it's important to note that the end of the bear market has not yet been confirmed, the possibility is definitely growing.
FOCUSING ENERGY ON COMMODITIESby Richard Rhodes | The Rhodes Report The FOMC has now become very serious to put an end to the financial crisis. To put it simply, Wednesday's FOMC announcement that they plan to roll the printing presses in order to buy $200 billion in longer-dated treasury paper is certainly a "positive." This will no doubt create more inflationary tendencies than we care to talk about, for the FOMC will be forced to buy far more in treasury paper than
anyone believe, so let's just call this the FOMC's "initial position." The fact of the matter is that it will be positive towards the commodity markets; and this is where we should focus our energies.
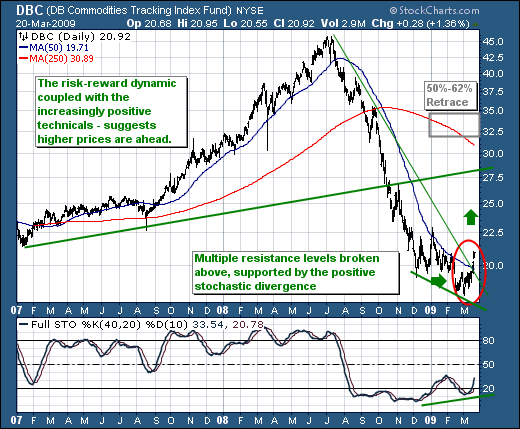
If one wants to get exposure to commodities other than through a futures contract, one can use the DB Commodities Index ETF (DBC), which includes the energies; the grains and other stuff the index is
made out. Moreover, we find that given this fundamental positive for the commodity markets, we also find that the technicals are syncing up with them as well - meaning the risk-reward dynamic favors being long
DBC now and on pull backs for the foreseeable future.
In particular, we are interested in fact prices moved to new lows and then rallied sufficient to breakout above trendline and 50-day moving avearge resistance levels, and did so not less on a "breakaway gap
higher." In our opinion, this is a powerful combination that should lead to mean reversion to overhead trendline resistance at $27.50, or even perhaps the 250-day moving average currently crossing at $31.00.
Given that DBC is currently trade at $21, we would only risk $2 to $19; thus the risk-reward is clearly skewed towards "reward" at this juncture.
Good luck and good trading,
Richard