TECHNICAL ANALYSIS 101 - PART 7by Chip Anderson | ChartWatchers This is the seventh part of a series of articles about Technical
Analysis from a new course we're developing. If you are new to
charting, these articles will give you the "big picture" behind the
charts on our site. if you are an "old hand", these articles will help
ensure you haven't "strayed too far" from the basics. Enjoy!
(Click here to see the beginning of this series.)
Chart Analysis - Support and Resistance
Prices are driven by two of humanityâs strongest emotions: Fear and Greed. When more investors are fearful that a stock will fall, it does! It will continue to decline until the balance between Fear and Greed is re-established. The same is true for greed and rising prices. This phenomenon is referred to as âMarket Psychology.â
Support is the price level where âgreedyâ buyers enter the market to prevent prices from declining further. Support can develop at a specific price or more commonly in a price zone. Areas of support can exist for many months at a time.
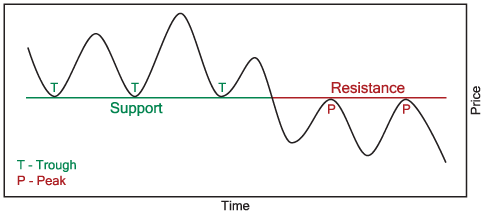
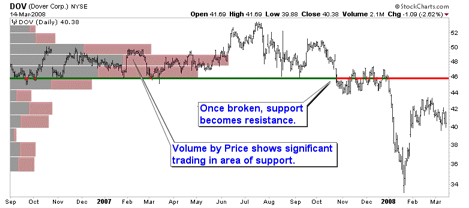
The diagram above illustrates how market psychology causes the previous area of price support to turn into resistance. After breaking support, traders who bought in the zone of support are now holding losses and want to sell as soon as prices approach their original purchase prices in order to break even.
The Volume by Price overlay (volume traded in incremental price ranges) in the following SharpChart of Dover Corp illustrates how strong support at 46 later became significant resistance as greed turned into fear.
The concept of resistance is opposite of the support as discussed above. Resistance is the price level where âfearfulâ sellers suddenly come into the market and prevent prices from advancing further. Like support, resistance can develop at a specific price or in a price zone and can be held for months at a time.
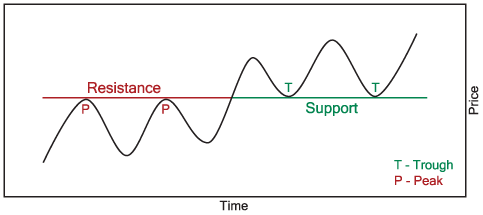
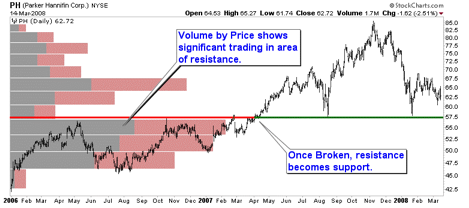
If resistance is broken, market psychology causes the previous area of price resistance to turn into support. The diagram above illustrates this market behavior. Stock holders who sold in the zone of resistance are now regretting selling and want to buy as soon as prices approach the level they sold at earlier. Prices that seemed too high before now look like a bargain. The following SharpChart of Parker Hannifin Corp. illustrates resistance later becoming support. Notice how Volume by Price indicates the potential number of previous sellers willing to buy again if given the opportunity.
Next time we'll discuss trendline analysis and trend channels.
MARKET FAILS TEST OF JANUARY HIGHby John Murphy | The Market Message I started the week on Monday with the headline that "Upside price and
time targets had been hit" and added that overbought readings suggested
that the market was vulnerable to profit-taking. The NYSE Composite Index
had just reached overhead resistance at its January high and its
200-day moving average as shown in Chart 1. A number of other indexes
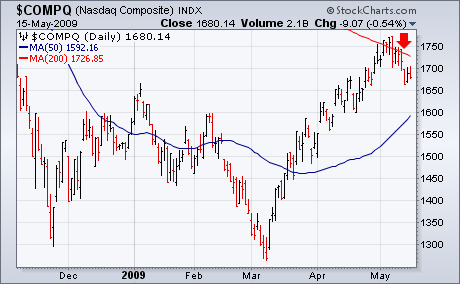
(like the Nasdaq Composite in Chart 2) and sector
indexes were stalled at their 200-day moving averages as well. So were
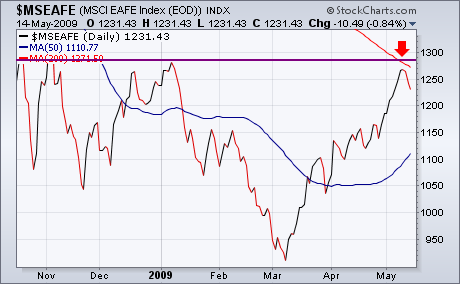
numerous foreign stock markets. Chart 3 shows the MSCI EAFE (Europe Australasia and Far East) Index
stalled at its January high and 200-day line. It was no surprise then
to see global stocks selling off this week. When a market has rallied
too far and is ripe for profit-taking, some fundamental trigger usually
starts things off. A weak retail report on Wednesday caused stocks to
sell off on heavy volume and got the correction started. After a modest
bounce on Thursday, stocks fell again on Friday. The result was a
weekly loss for all of the major stock indexes. I also suggested that a
pullback to the 50-day moving average was likely and could be part of
"right shoulder" in a bottoming formation. Arthur Hill expanded on that
idea during the week. In addition to some fundamental trigger, there
are technical triggers as well. Chart 1 shows two examples. The 14-day
RSI line (top of chart) broke its two month support line after reaching
overbought territory at 70. The MACD histogram bars (below chart)
turned negative (red circle). There were other technical triggers as
well.

DOW HITS RESISTANCEby Arthur Hill | Art's Charts After a massive 9 week advance, the Dow ran into resistance with its biggest weekly decline since early March. There is a resistance zone coming into play around 8700-8800 from the falling 40-week moving average and the Oct-Nov consolidation. After establishing support in Oct-Nov, this triangle consolidation now turns into a resistance zone. In addition, notice that 14-week RSI is trading in the 50-60 zone, which acted as resistance in April 2008.
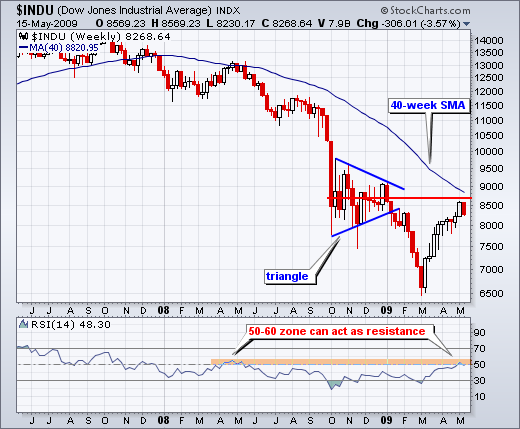
Prior to this week, the Dow was up eight of the last nine weeks and advanced around 2000 points. We do not need a momentum oscillator to figure out that this rally is overbought. With the Dow at resistance and overbought, the odds favor some sort of consolidation or correction. A consolidation would involve a flat trading range over the next few weeks, while a correction would involve a retracement of the March-May advance.
REVERSE HEAD AND SHOULDERS FORMING?by Carl Swenlin | DecisionPoint.com
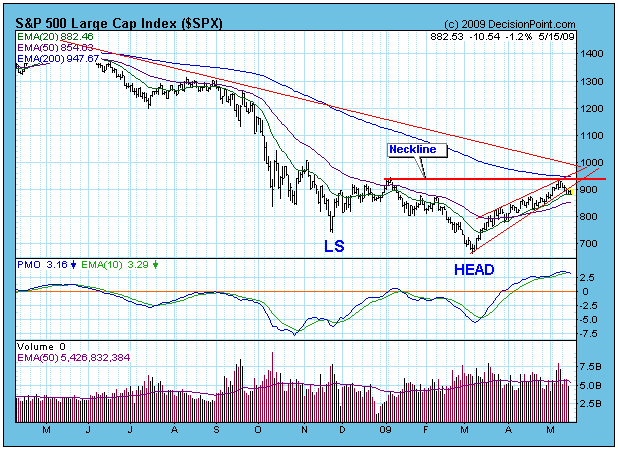
The ascending wedge pattern we discussed last week has broken down as
we expected. Considering that the market has rallied nearly 40%, I
think it is reasonable to expect more corrective action.
The next development to watch is the possible formation of a
reverse head and shoulders. We currently have the left shoulder, head,
and neckline. The correction that has started could result in a right
shoulder, if the correction does not turn into the next leg of the bear
market. The ideal resolution (if you are a bull) would be for the
correction to end in the area of 750-800, then for a rally to blast up
through the neckline. If that were to happen, the minimum upside target
would be equal to the distance between the top of the head and the
neckline -- about 1200. Interesting to contemplate, but, hey, we are
way ahead of ourselves at this point.
As you can see on the chart below, intermediate-term indicators
are still very overbought. This evidence supports the idea that the
correction is not over yet.
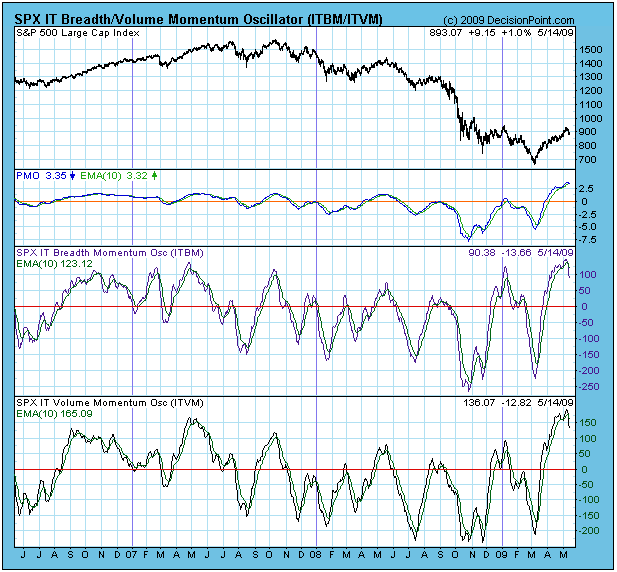
Bottom Line: The short-term indicators, although oversold, have shifted
from a persistently positive range to a more normal range. I interpret
this to mean that the invincible nature of the rising trend has come to
an end. Coupled with the fact that medium-term indicators are still
quite overbought, my conclusion is that there are probably a few more
weeks of correction ahead of us. The appearance of some elements of a
reverse head and shoulders offer some hope that a major bottom could be
forming, but it is too early to turn up the optimism in that regard.
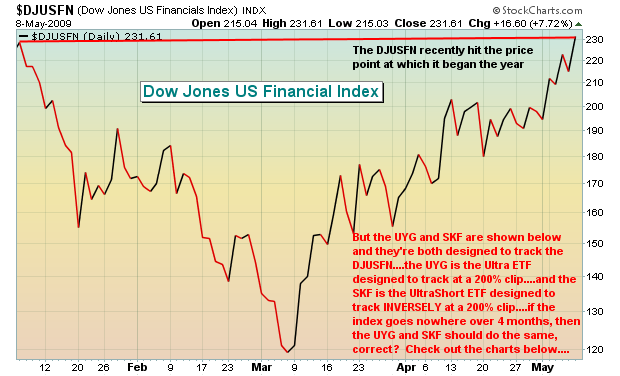
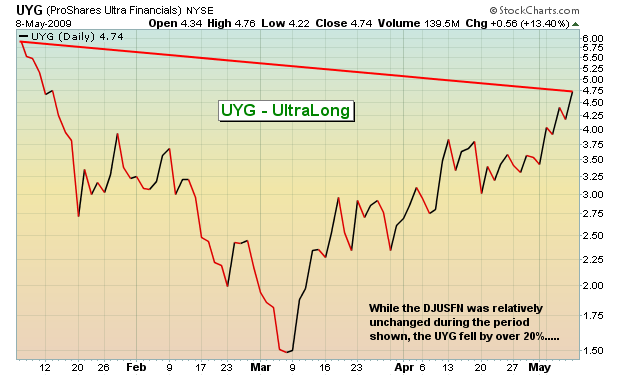
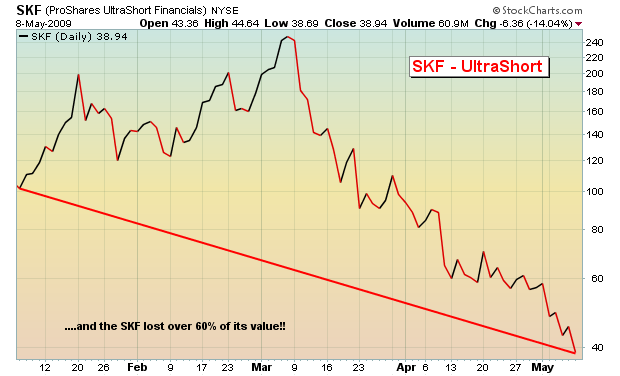
ANOTHER LOOK AT JUICED ETFSby Tom Bowley | InvestEd Central In February, I wrote an article discussing the fact that juiced ETFs (ETFs designed to double or inversely double the returns of an underlying index) do not perform as you might expect. There was a huge response to this article and mostly positive feedback. There are plenty of reasons why taking another look at juiced ETFs makes sense, but the inability to perform over longer periods is the primary one. To give you a recent example, the Dow Jones U.S. Financial Index fell precipitously early in 2009, but since has rallied strongly reversing earlier losses. From the January 6th high to the May 8th high, the index has been flat, but there was plenty of volatility in between. Because this index is the underlying index for the UYG (Ultra Financials ETF) and the SKF (UltraShort Financials ETF) and it was essentially flat over a four month period, it was an easy point of reference to determine how the UYG and SKF have performed in tracking that underlying index over time. Check out the 3 charts below:
till think it's a good idea to buy these juiced ETFs and hold them for monster gains? From the proshares.com website, here is the disclaimer on the SKF: "This ETF is designed to meet daily objectives; results over longer periods may differ. There is no guarantee that any ProShares ETF will achieve its investment objective." There are a couple of words I'd focus on here. First, and perhaps the biggest, is the word "daily". Juiced ETFs are designed to track their underlying index on a DAILY basis. That's it. So long as the underlying index moves in a straight line - either higher or lower, the juiced ETFs will perform as expected. As the underlying index experiences volatility, that back and forth movement is the cause of juiced ETF erosion. The second word I'd focus on is "may" as in "results over longer periods MAY differ. Throughout my studies, there is no question in my mind they WILL differ.
One of the primary reasons I decided to re-visit this topic was the sight of a "professional" on CNBC last week touting that he was "building" a position in URE (the Ultra ETF that tracks the Dow Jones US Real Estate Index). You cannot "build" positions in juiced ETFs. Every day that you hold these ETFs, your risks rise and your potential returns dwindle. It doesn't mean this professional won't make money. It simply means that risks grow every day the URE is held and potential "juiced" returns decrease. Isn't the essence of trading the desire to generate above average returns with below average risk? Building positions in juiced ETFs will have the opposite effect. If professionals are trading these juiced ETFs incorrectly, it only stands to reason that thousands, perhaps millions of individual investors are doing the same.
So the next series of questions arise - are all juiced ETFs created equal? Do they all lose value at the same rate? Do some hold their values better than others? Should you even consider trading juiced ETFs?
I want you to benefit from my study. I studied the recent volatile period - from September 1, 2008 through May 6, 2009. There were periods of chaos within this study, from the panic-driven selloff in October and November to the surge in prices off of the March lows. I feel this is a representative sample to determine performance of various juiced ETFs. Included in my study were the following indices (and their related juiced ETFs):
* S&P 500 (SSO and SDS)
* NASDAQ 100 (QLD and QID)
* Russell 2000 (UWM and TWM)
* Dow Jones US Financial Index (UYG and SKF)
* Dow Jones US Real Estate Index (URE and SRS)
* Dow Jones US Oil & Gas Producers Index (DIG and DUG)
To view this study and the results,
click here.
Happy trading!
EMERGING MARKETS TAKING THE LEADby Richard Rhodes | The Rhodes Report As the markets have rallied off the March 9th bottom, we find it rather interesting that the Emerging Markets have taken a lead role and have outperformed rather handily. The growing consensus believes that when the worlds' stock markets do bottom, then the Emerging Markets will take the role of "leader" once again. However, we would caution, for rarely do the leaders of past bull markets lead new bull markets. Moreover, and from a fundamental perspective - much of the Emerging Market economic growth was built upon the back of Western credit expansion and conduits to these countries rather than internal growth. Western banks were simply "reaching for yield"; and with higher yields come higher risks. We can only look at the debacle occurring in Eastern Europe; but that is a discussion for another day.
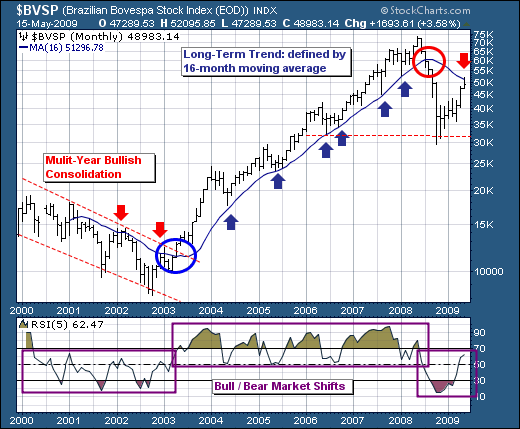
We would like to look at Brazil's BOVESPA Index, for it is quite simple from a technical perspective to delineate both bull and bear markets. And, it appears an inflection point / delineation point has just been reached - the 16-month moving average. For now, prices are weakening from this level, and if the 2000 to 2003 bear market is any guide, then the weakness we've seen from this level will continue and perhaps will result in a test of the lows quite far below current levels. If not, and prices rally above this level - then we can be rather comfortable with believing a new bull market has been born, and we should do nothing more than be buyers.
For now, the risk-reward favors selling short Brazil, and one can do that via EWZ; however, if the 16-month is violated to the upside, then one should be a buyer. We believe a bear market is in force given the manner in which the 5-month RSI is trading, but our battle line at the 16-month is drawn, and now we can asses our risk and trade around it.
Good luck and good trading,
Richard