This is the eighth part of a series of articles about Technical
Analysis from a new course we're developing. If you are new to
charting, these articles will give you the "big picture" behind the
charts on our site. if you are an "old hand", these articles will help
ensure you haven't "strayed too far" from the basics. Enjoy!
(Click here to see the beginning of this series.)
Trend Psychology
The psychology of fear and greed of market participants ultimately determines the direction of prices in a market. Prices rise with greed (demand) and fall with fear (supply). A price trend is simply a sustained directional price move. It can be thought of as a âtiltedâ support/resistance zone.
A trend will continue as long as either fear or greed is in control of a market. Trends fade or change direction as the balance of fear and greed changes. The extent of fear and greed in a market can be seen by how quickly prices are trending down or up.
Trending
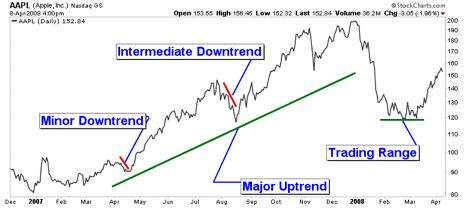
As stated earlier, a trend is a sustained directional price move. Rising peaks and troughs constitute an uptrend; falling peaks and troughs constitute a downtrend. A trading range is characterized by horizontal peaks and troughs. Trends are generally classified into major (longer than six months), intermediate (one to six months), or minor (less than a month). Long term are most interested with identifying long term trends where short term investors are more interested in minor and intermediate trends. The following SharpChart shows examples of the different types and categories of trends.
Trendlines
A trendline is a straight line that connects two or more low or high price points and then extends into the future to act as a line of support or resistance. The first two points establish the trend line while additional points validate it.

The following SharpChart is a real example of how an uptrend line is drawn with a trend change.

An uptrend line has a positive slope and is formed by connecting two or more low points. Uptrend lines act as support. As long as prices remain above the trend line, the uptrend is considered intact. A break below the uptrend line indicates that demand has weakened and a change in trend could be imminent.

A downtrend line has a negative slope and is formed by connecting two or more high points. Downtrend lines act as resistance. As long as prices remain below the downtrend line, the downtrend is intact. A break above the downtrend line indicates that supply is decreasing and that a change of trend could be imminent.
Next time we'll look at Trend Channels and Trend Changes.
Virtually all major market indexes (including the Dow) have now
exceeded their 200-day moving averages. That's a positive sign for the
stock market, and adds more weight to the view that a major bottom has
been seen. As I wrote a couple of weeks ago, however, the "direction"
of the moving average line itself is also important. Legitimate bull
markets usually require that the 200-day average also turn higher. For
that to happen, stock indexes have to first clear the 200-day line
(which they've done). Then, stock indexes have to reach the price level
formed 200 days ago. In other words, the latest closing price has to
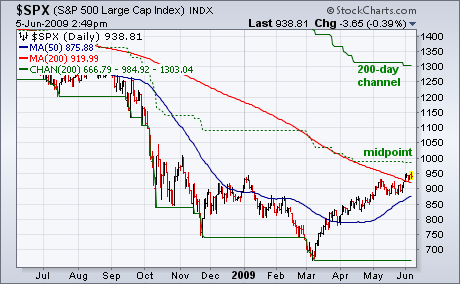
exceed a closing price 200-day days ago. The solid line on top of the chart below shows the 200-day "price channel" currently at 1303. It's doubtful
that prices will reach that level in the near future. The S&P has
yet to even clear the middle (dotted line) which currently sits at 985.
[The dotted line sits midway between the upper and lower channels and
often acts as resistance in a downtrend]. As good as the spring rally
has been (with most indexes having also cleared their January highs), I
believe that the market is still in need of some corrective action (or
consolidation) before moving substantially higher. V bottoms are
extremely rare. W bottoms are a lot more common. So are head and
shoulder bottoms. It seems unlikely that the market will continue to
rally in a straight line. More basing activity is most likely needed.
And that's going to require more time.
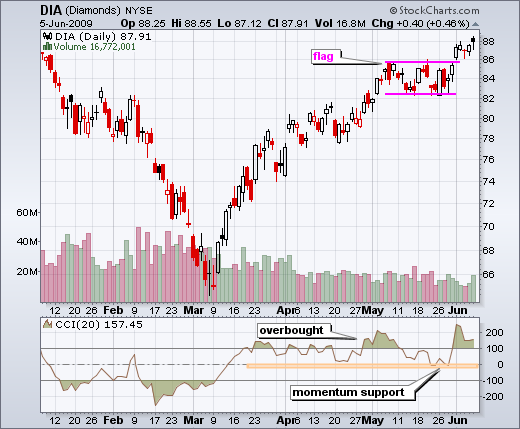
Even thought the Dow Diamonds (DIA) is overbought medium-term, the recent breakout is short-term bullish and this breakout is holding. On the daily chart, DIA broke above flag resistance with a surge on Monday. This move pushed CCI above 100 to turn momentum overbought. Even so, I would consider the trend both overbought and strong as long as CCI holds above 100. Notice how CCI bounced off the zero area in late May. Medium-term momentum should be considered bullish as long as CCI stays positive.
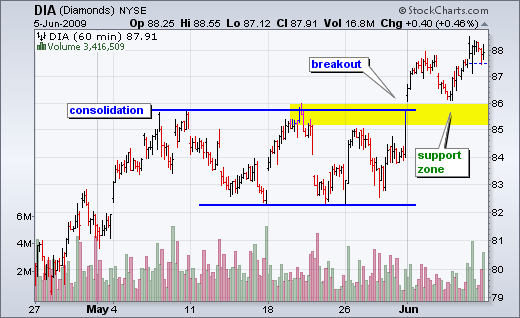
The second chart shows 60-minute candlesticks to focus on the recent breakout. This chart features a consolidation, a breakout and a support zone (yellow area). A key tenet of technical analysis is that broken resistance turns into support. In other words, a strong breakout should hold. Failure to hold this breakout and a move below the yellow support zone would be short-term bearish. As such, this is the first support area to watch for signs of a trend change.
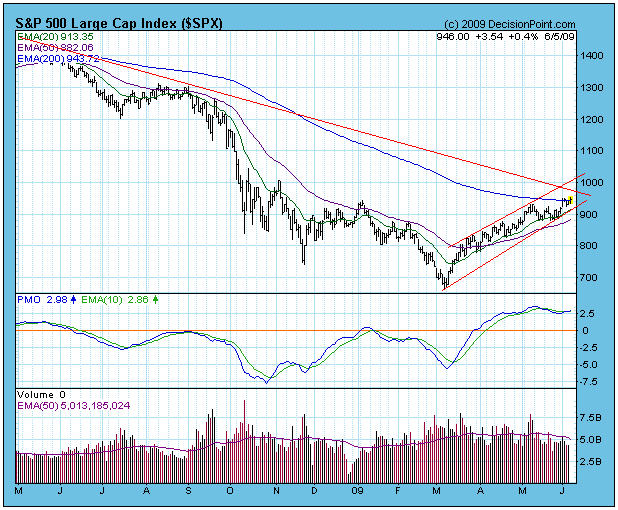
On the chart below we could attach a callout window to the rally that
began in March and entitle it "Bull Market Rules Apply". Bull market
rules generally mean that bullish setups will almost always resolve
positively, and that bearish setups will usually fail to execute,
because the market is being driven by a strong bullish bias. For
example, at the early-May price top we had a perfect setup for a price
reversal that could have declined into a nice correction. Many
medium-term indicators were very overbought, and that condition needed
to be cleared.
However, instead of correcting downward, prices moved sideways
in a consolidation pattern, clearing the overbought condition without
giving up any significant ground. Then at the end of the consolidation
a strong breakout occurred. This breakout could have been a blowoff
top, but, instead of immediately reversing downward, prices began to
consolidate (so far for four days), erasing any hope the bears may have
had for a decline.
Now, as you can see, prices have hit resistance at the 200-EMA.
Not only that, but there is a long-term declining tops line just ahead.
This resistance is strong and significant, and a reasonable assumption
is that prices will be turned back from it.
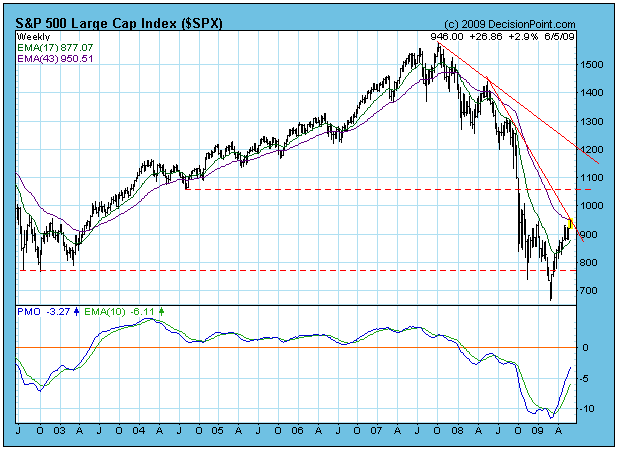
On the weekly-based S&P 500 chart below, the declining tops line is
displayed in its entirety, and its significance is more easily grasped.
So what's next? If the underlying bullish market bias persists, then
the resistance will be overcome; however, the rally has gone long and
far enough that it could be time for it to end. I think it is too late
to open new longs, and too early to go short. We have been on a buy
signal since March 17 and are sitting on a nice gain, so we can
comfortably sit tight and wait to see what happens.
Bottom Line: We have experienced a nice rally from the March
lows, but the price index has encountered important, and presumably
strong, resistance. The chart evidence make a compelling argument that
the rally is finally over, but the market's positive behavior to date
warns against getting too bearish too soon.
As the current rally perpetuates beyond what reasonable technicians would have thought at this point - the buying surge has now surpassed 57 trading sessions, it would appear traders are searching rather intently for those "laggard" groups or stocks to provide them with enhanced risk-reward benefits. This is certainly reasonable we think for the theory is that they will eventually play "catch up" with the broader market as gains in other "high beta" groups are wrung out. To this end, we believe that the Pharmaceutical-Healthcare-Biotechnology groups offer just such a "catch-up" potential.

Our focus today is upon the AMEX Pharmaceutical Index/S&P 500 Ratio ($DRG/$SPX).Clearly $DRG has broken out against $SPX given the declining trendline breakout, with the ratio subsequently correcting lower in a reasonable fashion to "kiss" the breakout level. Thus far, this "kiss" has been successful, with the 20-week stochastic now at oversold levels - a circumstance that in the past with an increased probability of a rally developing. This time should prove no different, and if we had to forecast...we would believe that the highs near .33 would be taken out on any rally.
If we had to postulate two rather interesting individual stocks to be long, then we would look towards Abbott Labs (ABT); Sepracor (SEPR) and Cephalon (CEPH).
Good luck and good trading,
Richard