Hello Fellow ChartWatchers!
Is the two-month old rally coming to a end now that April has arrived? The Dow's PPO is tantalizingly close to a bearish crossover right now. Arthur Hill sees weakness in the S&P 500 while Tom Bowley still sees opportunities. Read their thoughts below for more details.
The Road Ahead
At StockCharts, we are constantly improving the website. Recently, we've begun transitioning from using Sun's Java to power our interactive tools to using Adobe's Flash. There are several reasons for this change:
- Flash works for more people - Our customer support team gets at least 4 or 5 complaints every week from someone having problems with Java that we can't solve. So far, we have not had any complaints from someone who can't get Flash to work.
- Flash starts faster - Most new people who visit our website have already visited a site with some Flash content, thus when they start a Flash program on our site, it starts very quickly. Java can take up to 60 seconds to begin running our program.
- Flash allows us to create richer, more interactive tools. Flash provides us with better looking graphics and animation effects that we plan on incorporating into our tools very soon.
- Because Flash is quicker to start, it can be integrated into other tools - specifically the SharpCharts workbench. Check out my "Inspector" announcement below for an example.
We realize that for some people, running Flash-based tools presents a problem so for now we will continue to provide Java-based versions of our current tools as well.
During this transition, we have been working on a Flash-based version of our ChartNotes annotation tool. The goal of that tool has been to copy the look and feel of the Java version as closely as possible. At this point we think we've done that. People who have used the Java version for years should be able to use the Flash version and feel right at home. Please let us know if that is not the case.
Given that the Flash version and the Java version are almost identical, people have been asking "Which one should I use? Why should I change over to Flash?"
At this point, everyone should be trying to use the Flash version of ChartNotes and only use the Java version if they experience problems.
"The Inspector" - The Start of an Exciting Future
As to "Why Should I Change to Flash Now?", a key reason is because a new feature will soon appear that you will probably want to use and that new feature relies on Flash's speed and better looking graphics capabilities. We call it "The Inspector" and we are starting a Beta testing period for it today.
"The Inspector" allows you to mouse over ANY SharpChart and see the values of any point on the chart without needing to go into ChartNotes. It gives you a set of light-gray, moveable crosshairs and a data box that follow your mouse when it is over the chart.
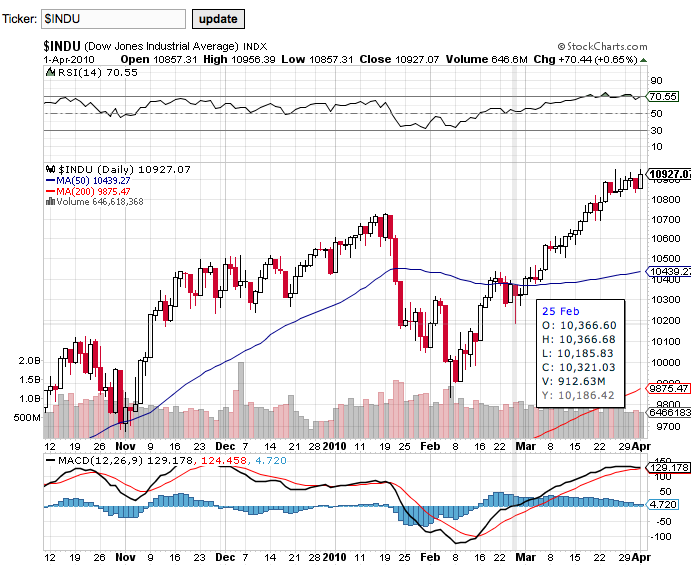
This screenshot doesn't really do it justice, you need to see it in action. Fortunately, you can take The Inspector for a limited test drive by clicking here.
Because "The Inspector" is so small and fast, we are going to be able to "build it in" to the SharpCharts Workbench. The idea is that soon all of the charts on the workbench page can be "inspected" just by mousing over them. The current "test drive" page doesn't give you full access to the workbench yet, but it will soon.
We are still actively working on "The Inspector" and will probably make some changes before it is officially released. Still we'd like to hear your feedback on this new tool and our new Flash-based direction.
Happy Easter everyone!
- Chip
Stocks and commodity markets rallied on Thursday on news of an expansion
in manufacturing in China, which is the world's biggest user of
commodities. A few weeks back I wrote that weakness in Chinese shares
was one of the factors weighing on commodity markets (along with a
stronger dollar). With the dollar looking overbought and vulnerable to
profit-taking, attention is now turning to China. And the news there is
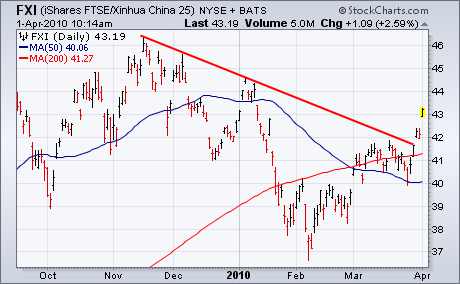
good. Chart 1 shows the China iShares (FXI) surging
2.5% on Thursday to the highest level in three months. The FXI has also
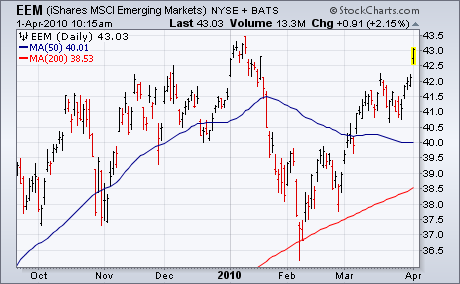
broken a five-month resistance line. That's giving a strong boost to Emerging Market iShares (Chart 2) which are soaring (thanks also to big gains in Brazil, India, and Russia).
The S&P 500 ETF (SPY) and Nasdaq 100 ETF (QQQQ) are trading near the upper trendline of a rising price channel that extends back to August. I drew the lower trendlines first, created a second parallel trendline and then moved it up to match the reaction highs. After a sharp advance the last 6-7 weeks, both SPY and QQQQ became overbought and hit channel resistance. The first chart shows SPY stalling near the upper trendline the last two weeks. The second chart shows QQQQ hitting the upper trendline last week. The odds of a pullback or consolidation certainly seem high with these key ETFs overbought and channel resistance at hand, but we have yet to see any weakness.
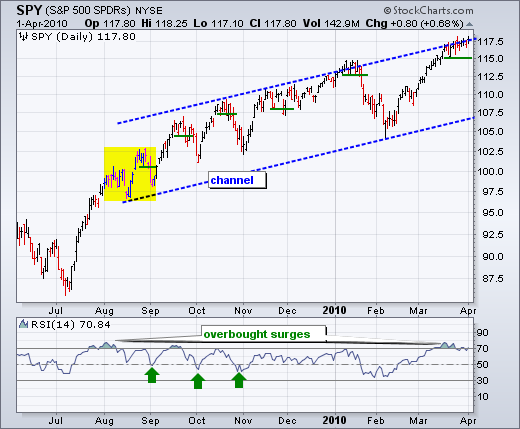

The current overbought period is the longest since July-August, when RSI was above 70 for over two weeks. Prior to Jan-Feb, the last correction was in June-July. This correction ended with a surge that created extended overbought conditions into August. The July-August overbought condition did not foreshadow a correction. Instead, it foreshadowed a period of choppy trading (yellow areas) and a subsequent advance to new highs. Pullbacks pushed RSI just below 50 and ended when RSI crossed back above 50 (green arrows). These RSI dips provided a means to participate in the ongoing uptrend. Going forward, this strategy is certainly not fool proof, but it is something to think about with RSI trading near 70.
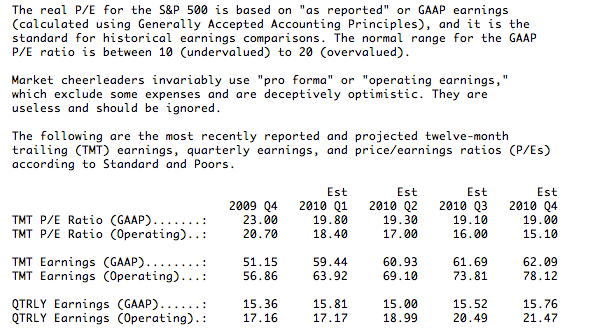
S&P has still not finalized 2009 Q4 earnings, but 99% of companies
have reported, and I want to get the most current earnings picture out
there, so I have updated our database to TMT earnings as of Q4 2009.
This causes the horrible Q4 2008 numbers to drop out of the equation
and gives us a more realistic look at valuations.
The chart below shows the S&P 500 in relation to its normal P/E
range (10 to 20). The colored arrows on the right help to clarify where
the cardinal points of the range are now located.
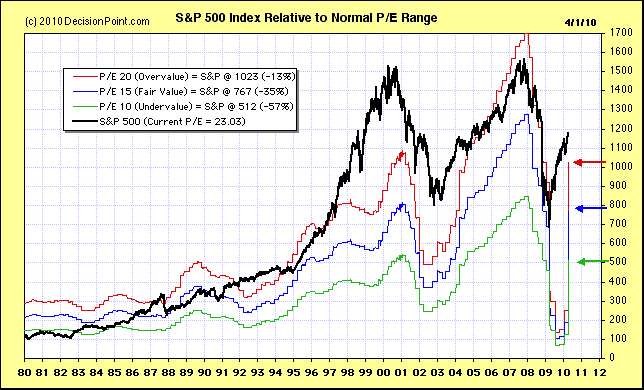
While the picture has improved considerably from a year ago, the
S&P 500 is still above the overvalue limit with a P/E of 23. By the
end of the year (see below), earnings are expected to improve, but
still not enough to get valuations anywhere near fair value (15). If
prices continue to advance, the market will remain extremely
overvalued.
If you're looking for sector leadership in 2010, look no further than the industrials. While other sectors have performed admirably, especially financials and consumer discretionary, none top the 13.13% year-to-date gain that industrials are sporting. Compare that return to the paltry 0.57% gain in technology. Because we've been witnessing a lot of sector rotation, we'd expect to see technology have its day soon, but for now the group can't seem to catch a relative bid. Keep in mind that as recently as one week ago, energy found itself in that exact position. It was down year-to-date, but last week's monster gains changed all that. Energy blew away all sectors last week, gaining 4.39% in the process. Energy bounced off of trendline support, but the sector ETF, XLE, still needs to close above 60 and distance itself from this level. On recent attempts, it's failed. Take a look at this three year chart of the XLE:
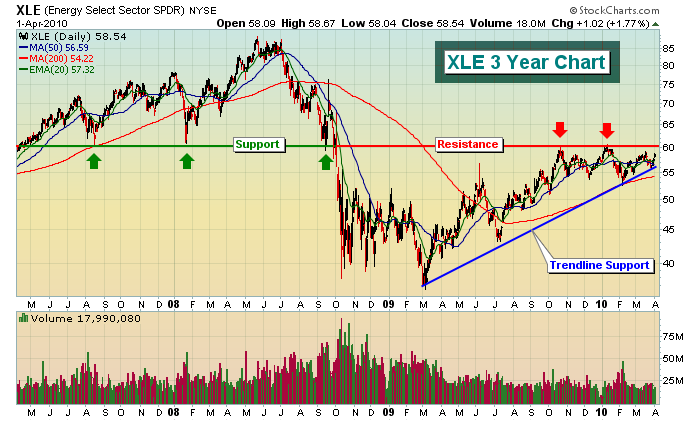
While energy looks to key resistance just above current prices and technology looks to regain its form from years past, the industrials are quietly sailing along, having posted gains in 7 of the last 8 weeks (off the February 5th bottom). The one week where industrials "struggled", the XLI lost two pennies. So over the course of the last two months, industrials have barely paused during their steady march higher. How can the group be played on the long side after this huge run up? Well, very carefully of course. Just as money rotates between sectors, it too rotates between stocks within a sector. Therefore, it stands to reason that chasing stocks making 52 week highs with very overbought momentum oscillators within the sector doesn't make much sense. However, stocks in a sector rarely move simultaneously. There are opportunities on a daily basis. One industrial stock that surged on Thursday, breaking above price resistance and its 50 day SMA, carries an RSI of 61 and stochastics of 68, hardly overbought in this environment. I'm featuring this industrial as our Chart of the Day for Monday, April 5. CLICK HERE for details.
Happy trading and HAPPY EASTER!
The market rally higher has taken quite a few stock groups along for the ride - most notably the Consumer Discretionary and Industrial sectors. However, we've begun to see some very small rotations out of this group, and into the Energy group. This interests us greatly, for Crude Oil prices are now hard upon the $85/barrel level and showing signs of moving still higher. This will benefit the Energy group disproportionately given the broader Energy sector has under-performed the S&P 500 by roughly -4.0% this year. This is on top of further under-performance last year of over -4.0%. Thus, we believe the time has come to own Energy shares. But which sub-set of Energy do we want to own?
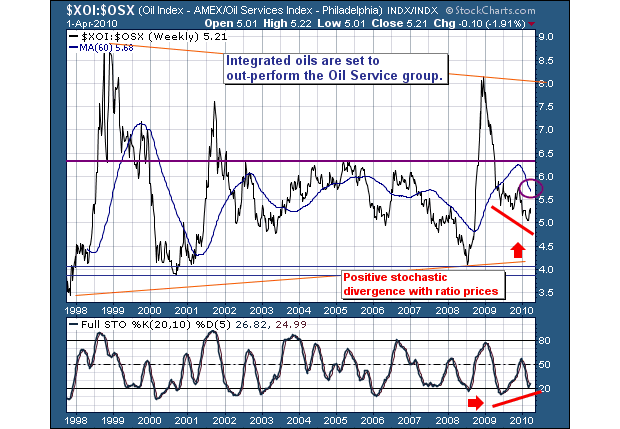
If we look at the Integrated Oil/Oil Service groups ratio, then we find the Integrated Oils have underperformed rather markedly as they normally due out bear market bottoms. However, we're starting to see signs in the ratio that it is turning higher towards its 60-week moving average. A breakout above this level would obviously be positive and would suggest roughly a +20% integrated oil out-performance in the weeks and months ahead. Too, we find the 20-week stochastic fat oversold levels and more importantly - forging a positive divergence with ratio prices. This would seem to be the perfect setup.
Thus, while many Oil Service stocks have bullish patterns, we think it more prescient to consider shares in Devon Energy (DVN) and Conoco-Phillips (COP) at current levels.
Good luck and good trading,
Richard