For the past couple of months, I've been visiting with investments clubs around the country who have been gracious enough to invite me to talk. So far I've talked with clubs in Portland, Pheonix and Dallas. Calgary, Denver, and Houston are coming up with east coast cities to follow in the fall.
I wanted to show you a couple of the slides I used in my Dallas presentation yesterday and give you a pointer to our handout so that you were aware of some of the things in my talk even if you haven't attended one. (At some point, I'll try and post the complete version of the presentation - but that won't be for a while.)
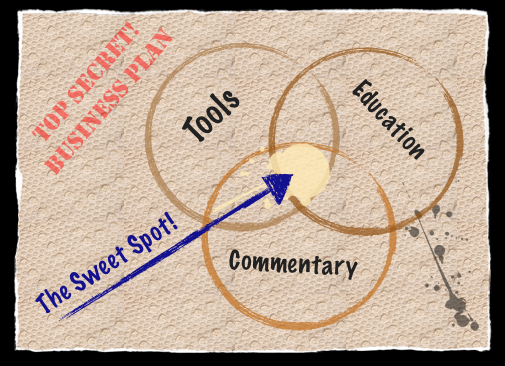
Above is our "top secret" back-of-the-napkin plan for ruling the world. Basically, when John Murphy or Arthur Hill or I write market commentary, we try to make them timely, educational and based on tools that our readers have access to.
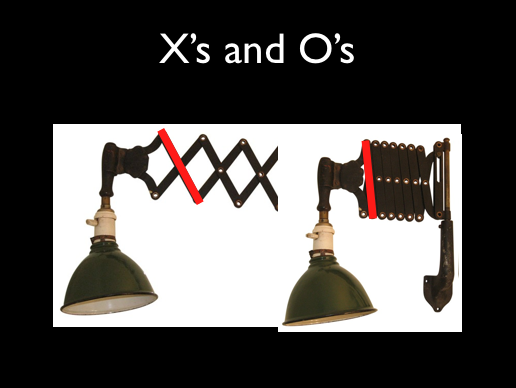
Did you know Point and Figure charts are like "scissor" lamps? It's true! When it is stretched out, it's like the trendlines on a regular bar chart. When it is collapsed, those same trendlines become vertical columns on a P&F chart.
Finally, here's a high-level process flow for doing technical trading:
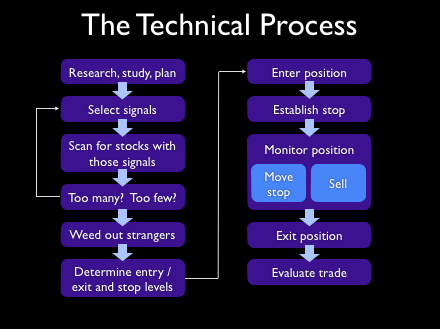
My presentation then shows how many of our tools can be used to support this process.
- Chip
Financial stocks are considered to be leading indicators for the rest
of the market. Over the last year, the group has led the market higher.
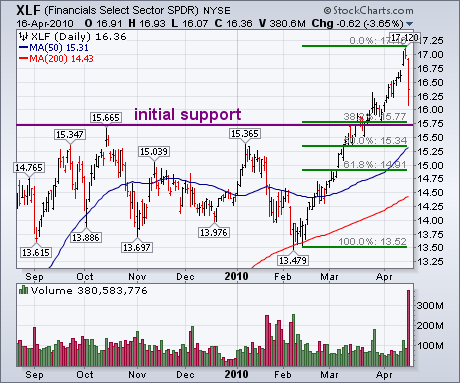
Yesterday, they led it lower. The chart below shows the Financial SPDR (XLF)
falling 3.6% on huge volume. The big volume is more serious than the
price drop. With the group (and the market) having rallied two months
without a pullback, one certaintly seems overdue. And it may have
started yesterday. If this just a short-term pullback, the XLF should
find support along its January high. The green lines show that would
also be a 38% retracement of the February/April rally. The ability of
the XLF to stay above that initial support level will help determine if
this is just a short-term pullback or something more serious.
STOCKS: Based upon a 3/1/2010 Thrust/Trend Model buy signal, our
current intermediate-term market posture for the S&P 500 is
bullish. The long-term component of the Trend Model is on a buy signal
as of 8/11/2009.
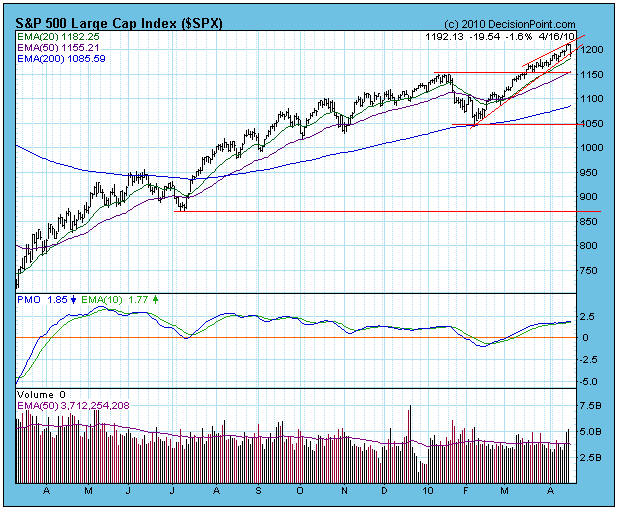
On Wednesday the S&P 500 broke up and out of the short-term
ascending wedge pattern on expanding volume. On Thursday there was a
small follow through advance on expanding volume, but short-term
internals showed weakness, and it looked to me as if a pullback toward
the point of breakout was likely. Instead, the breakout was a fakeout,
and prices fell through support all the way back to the short-term
rising trend line. At this point no damage has been done to the
technical picture on the daily chart.
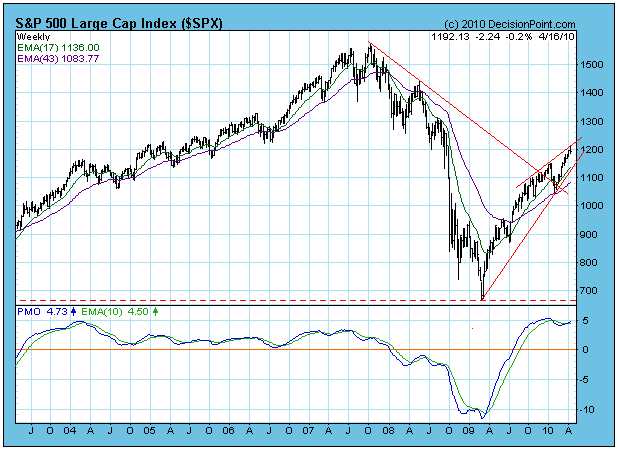
I do have concerns when I look at the weekly chart. Prices are at the
top of an ascending wedge formation, and a correction back to the
rising trend line seems the most likely next move. Could be that
today's decline was the beginning of that correction.
In my first article of 2010, I indicated that financials would need to lead on a relative basis in order for us to see strength in overall equity prices this year. Until late last week, financials have performed very well on a relative basis. Take a look visually at what I was referring to:
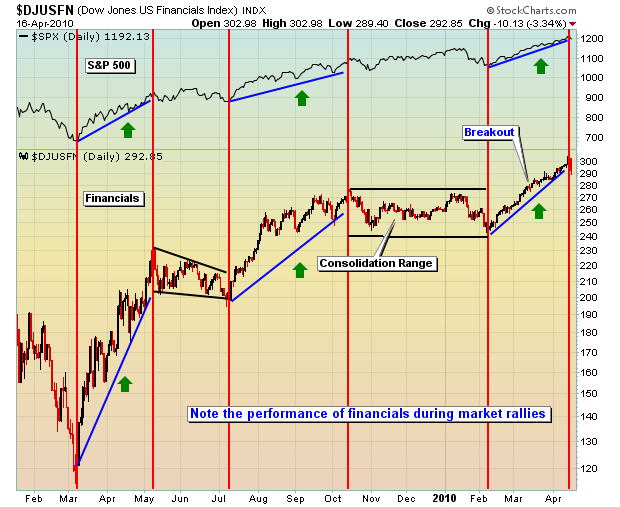
It's quite evident that the market is going only as far as the financial sector can take it. That leads to one very important question. Will the technical problems that surfaced this past week be resolved quickly in the upcoming week, or is the market finally ready to pause and collect its breath? While nothing is ever a guarantee in the stock market, my bet is that financials will underperform for at least a short period of time and that will stymie the market's advance. So what damage was caused?
First, take a look at the weekly chart of the Dow Jones US Financial Index:
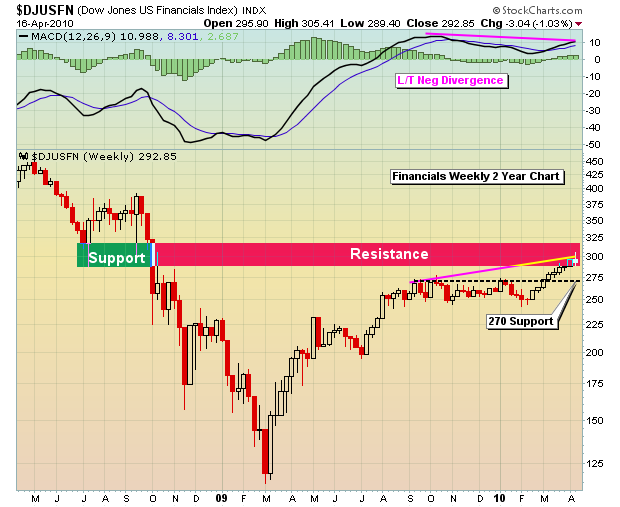
The long-term negative divergence that's present here raises intermediate-term concerns because such divergences on weekly charts tend to keep the bulls at bay for weeks, if not months. The heavy volume reversal in financials late this past week printed a dubious candlestick for the week. Our Chart of the Day on Friday morning featured a shorting opportunity on Citigroup (C). Check out this chart:
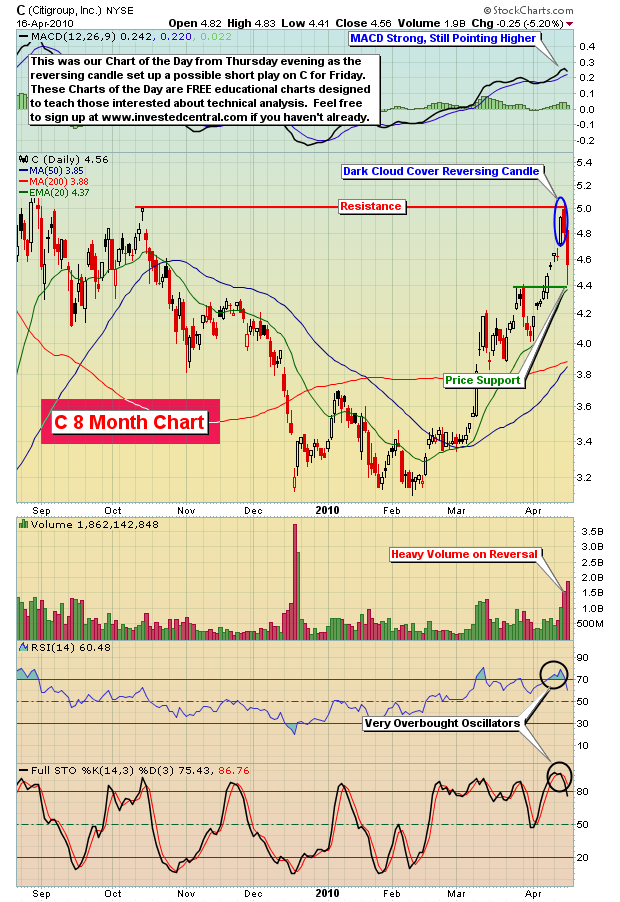
C immediately fell to the short-term price support that we mentioned near the $4.40 level. Now C rests in a trading range of $4.40-$5.00. Let's see which level falls first. Another short-term negative was the market's reaction on Friday to two solid reports. Bank of America (BAC) tripled profit expectations, yet that large financial finished the day -5.49%. General Electric (GE) also posted excellent results, but fell 2.7% on heavy volume and with a long-term negative divergence present on the daily chart.
Adding to the bears' fuel on Friday was the announcement that the SEC is alleging that Goldman Sachs (GS) defrauded investors out of $1 billion relating to mortgage investments. I'm not going into the details of the allegations, but help me with the math here. GS lost $23 per share on Friday, or $12 billion in market cap, because of $1 billion defrauding allegation? Is there more to it than what was provided in the initial news release or was this a complete overreaction on options expiration day? I guess we'll find out soon enough.
But here's the really ironic part of the GS story. GS has market making operations. Does anyone else see the irony in this being announced on options expiration Friday? Let me tell you that prior to Wednesday, the largest daily spread of equity calls traded vs. equity puts traded was 1.5 million contracts. After Intel (INTC) reported better-than-expected earnings on Tuesday, the spread of equity calls vs. equity puts skyrocketed to 2.0 million contracts on Wednesday. On Thursday, that spread was 1.8 million contracts. In other words, options traders have NEVER been so optimistic about the short-term market prospects and when everyone is buying up those calls, who is on the other side of the trade? Well, it's one of the responsibilities of the market maker - to provide liquidity in the marketplace. My proprietary relative complacency ratio hit 29% by Thursday's close. This is a useful sentiment indicator based on equity options trading and it marked the second consecutive day over 25%, which are the only two days it's ever been that high. Relative complacency generally marks tops. I've never seen the market print extreme readings like the ones on Wednesday and Thursday. So now let's discuss the timing of the SEC's Friday announcement. While GS likely stands to be slapped on the wrist at some point in the future for these alleged violations, I can only imagine how much the timing of the SEC's announcement cost all those call buyers on Wednesday and Thursday and helped turn profits at market making units like Goldman Sachs'. Let me just guess that it's more than $1 billion and leave it at that. I'm calling it the 2010 financial bailout, as if they needed another.
Ok, enough of my rant and back to the technicals. Unless the bulls can show even more resilience and print a new high on financials, we'd look at the action this past week as a topping candle. That sets up solid risk/reward shorting strategies in this space. If financials break to new highs, a small loss is taken. But if this truly does mark an intermediate-term top, an entry into the juiced ETF that tracks financials (SKF) wouldn't be a horrible strategy. CLICK HERE for our Chart of the Day for Monday, April 19th for more details on how to approach this potential trade.
Finally, I'm excited to announce that Invested Central will be hosting our first monthly event of our just announced Online Trader Series on Tuesday, April 20th at 4:30pm EST, which will cover trading strategies of juiced ETFs in general. If you trade juiced (or leveraged) ETFs, there are strategies to maximize profits that are critical and we'll discuss them in detail. CLICK HERE if you're interested in learning more.
Since the beginning of the year, the market "Generals" if you will have been the S&P Consumer Discretionary, S&P Financial and S&P Industrial sectors given they are the only sectors to have out-performed the S&P 500. However, there is only one sector that has out-performed in both 2009 and 2010 - the S&P Consumer Discretionary sector. This is obviously counter-intuitive given the enormous de-leveraging occurring in the US economy and in particular with the US consumer - although recent retail reports simply haven't proven this to be much of an issue. Be that as it may, with the broader market seemingly ready for a correction, we think the consumer discretionary stocks are primed to be the leaders on the downside.
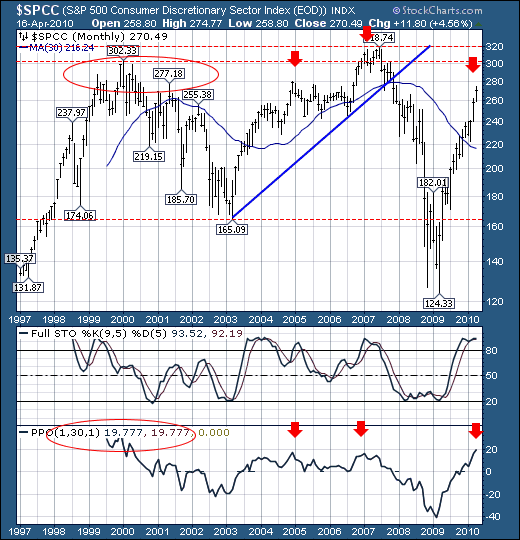
If we step back and take a long-term look at the sector, we find that since the March-09 bottom, prices have rallied a mere 117%. But more importantly from a technical position, we find prices towards the upper end of their range of the past 13-years, with the 9-month stochastic overbought, with the percentage above their 30-month moving average trading at 20%. In the past, a 20% reading has coincided with a correction of some magnitude. Hence, there is certainly absolute as well as relative risk in the consumer discretionary space, which we would posit is in for a corrective period of several months in the least back towards its 30-month moving average...or a potential decline of roughly -20%.
That being said, if money exits the consumer discretionary space, then we're likely to see it re-enter another space. Our preferred choice for this rotation is the S&P Energy sector...which has lagged both in 2009 and 2010. It is simply energy's turn for sponsorship...especially when one considers they ratio between the S&P Energy sector and crude oil prices is at long-term historical support.