Hello Fellow ChartWatchers!
Today we're taking the wraps off of our upcoming major upgrade to our ChartNotes annotation tool. We've been working on this for a while now and we are getting close to releasing it out to everyone. Even though it will probably be a couple more weeks before things are ready for release, I wanted to give you a sneak peek at some of the features that are headed your way soon. Check out this screenshot:
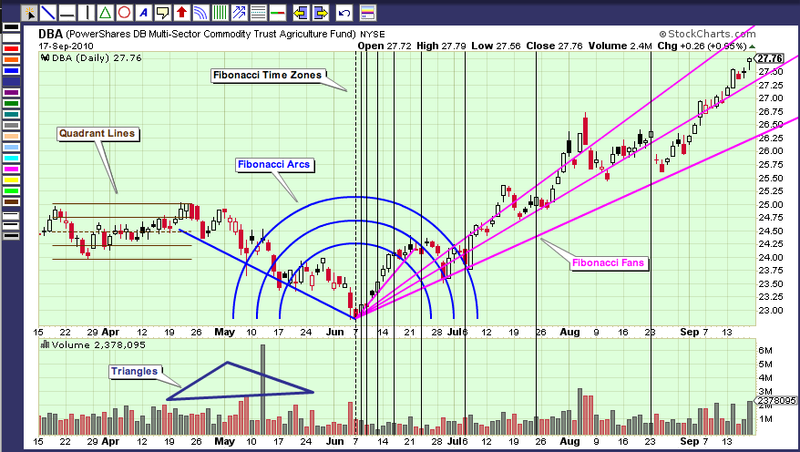
In addition to all the new Fibonacci tools that we're adding, you'll also notice a new Triangle shape tool and the Quadrant Lines tool. As you can see, this new version of ChartNotes is mostly about adding more drawing tools and capabilities. There are several other new features that aren't shown on this chart. I'll be posting more about those features, including our new Elliott Wave annotations feature, on the website later this week.
Again, these features aren't available on the website just yet - we have some internal testing to complete first. Keep an eye out for more announcements on the "What's New" area of our website for more info on when ChartNotes v2 will be released.
- Chip
BASIC MATERIALS LEAD MARKET RALLYby John Murphy | The Market Message I wrote on Tuesday that strength in foreign currencies (especially
commodity currencies like the Aussie and Canadian Dollars) was negative
for the U.S. Dollar but positive for most commodities. One reason for
that view is that stronger foreign currencies suggest growing
confidence in the global economy. Another sign of growing optimism is
that basic materials (which are tied to commodites) have been the
strongest market sector since the market bottomed in early July.
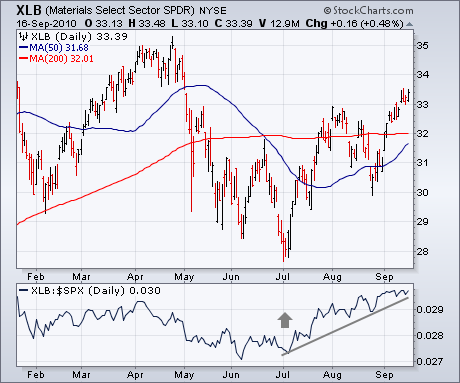
Chart 1 shows the Materials Sector SPDR (XLB) already
trading at the highest level in more than four months. Its rising
relative strength ratio (below chart) has been rising over the last two
months which shows superior performance by the economically-sensitive
group. Another reason for their superior performance since the start
of July is the fact that the U.S. Dollar is weakening again. That's
normally bullish for commodities and stocks tied to them.
Leadership from three of the four key offensive sectors makes the September surge all the more impressive. I consider the consumer discretionary, finance, technology and industrials sectors as the offensive sectors that are key to the stock market and the economy. Leadership from at least 2 of the 4 is needed for a rally to have legs. Consumer discretionary represents the most economically sensitive sector (think retail). Finance represents the health of the banking system. Industrials represent the industrial base. Technology represents the appetite for risk with its high-beta stocks.

The S&P Sector PerfChart shows the consumer discretionary, technology and industrials sectors up over 8%** this month. All three are up more than the S&P 500, which means they show relative strength and upside leadership. These are the sectors the bulls want to see leading the market higher. The fourth wheel, finance, is up less than 8%, but still outperforming the broader market with a respectable 7.79% gain. The only negative here is the short-term overbought conditions after such a sharp advance in a short period of time.
NEW LONG-TERM BUY SIGNALby Carl Swenlin | DecisionPoint.com Today
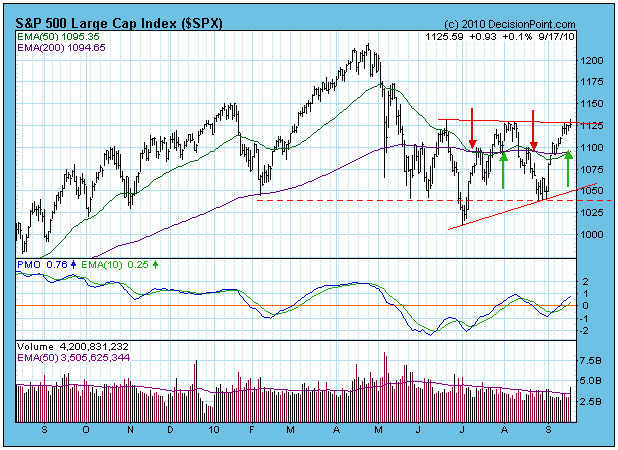
another long-term buy signal was generated when the S&P 500 Index
50-EMA crossed up through the 200-EMA. Normally, we have high confidence
in these signals, but, unfortunately, the long-term model has generated
four, count 'em, four "long-term" signals in less than three months. On
the chart below the red arrows mark the sell signals and the green
arrows the buy signals. Prices have entered a trading range and, as you
can see, they move just far enough in one direction to trigger a signal,
then they reverse and go just far enough in the opposite direction to
trigger the reverse signal.
This
is not typical of how the model usually works, but any mechanical model
will eventually run into rough patches where peculiar price movement
defeats them. This is one of those times, and as long as the 50-EMA
keeps making these shallow cuts back and forth, our confidence in the
signals will not be robust.
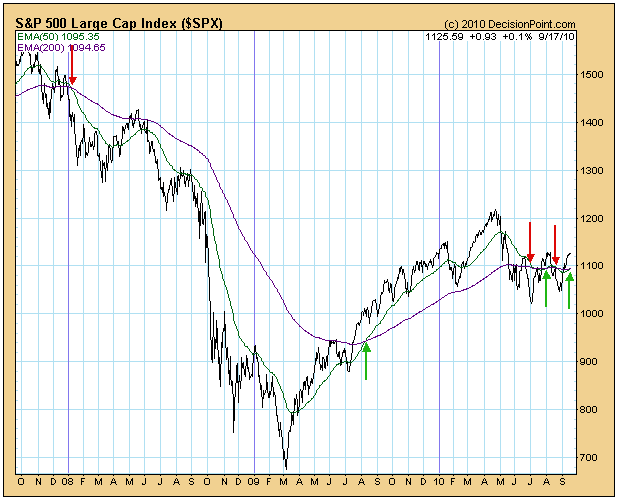
The
chart below shows a three-year time frame, and the first two signals
(sell in January 2008; buy in August 2009) are what we would classify as
normal. Note that the 50/200-EMA cuts are relatively steep and are
quickly confirmed by price movement.
Our
long-term signals are used primarily to identify the long-term trend of
the market so as to have a context within which to make decisions in
the intermediate-term time frame. Nevertheless, we expect the model to
have a profitable record over time, and it does. See our Timer Digest rankings rankings through the link on this page or on the website.
Bottom
Line: The question now is how much faith do we put in this new buy
signal. Since it is a buy signal, I would say that it gives the bulls a
slight advantage, but my confidence will really blossom when prices
break through the overhead resistance at about 1130 that has stopped
progress three times since June.
FINDING THE NEW EMERGING LEADERSby Tom Bowley | InvestEd Central Let's do a case study.
Wouldn't it be great to find the next Google (GOOG) or Apple (AAPL) in the early stages, before the meteoric rise? It's definitely possible, but it takes homework and TONS of patience. Every great long-term performer goes through similar breakout stages. They will base, many times for long stretches, before another breakout occurs. They tend to be strong relative performers, meaning they tend to base when the market breaks down and soar during market advances. Occasionally, they even flat out break down before later resuming their march higher with a vengeance, or what I like to call an "exclamation point". Let's use Netflix (NFLX) as our case study. Since the beginning of 2009, NFLX has risen 400% from $30.00 to $150.00. It hasn't been straight up every day, though, as there have been plenty of bumps along the way. First, look at the overall performance:
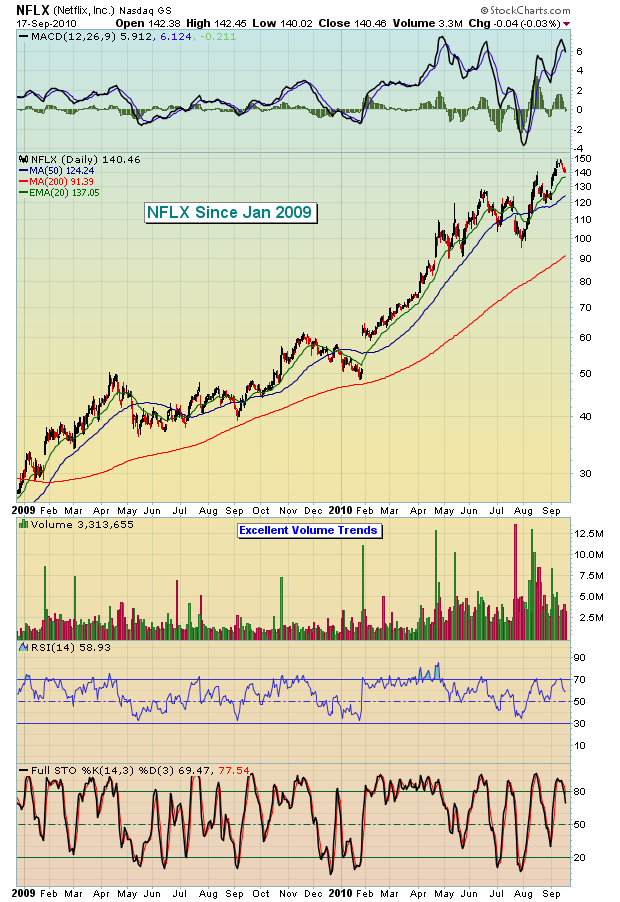
While everyone wants to be in at the bottom, what were the key signs that suggested that this type of advance might be possible? Well, check out the action just before this impressive rise began:
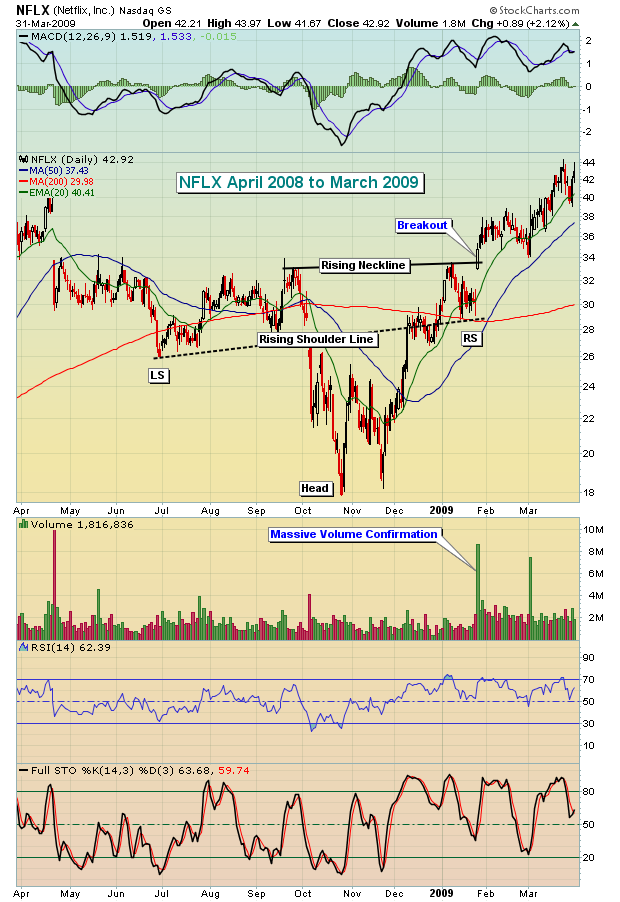
NFLX was downtrending aimlessly. It certainly was emanating few signs of a potential blockbuster move to the upside. But then came THE pattern. It was simple enough - a potential bottoming head & shoulders pattern. The key part of these technical patterns, however, isn't the formation, but the "firmation", as in CONfirmation. That occurs when the volume on the breakout leaves you breathless. You don't have to wonder if the volume is of the "confirming" variety. It's quite apparent. NFLX broke out in January 2009 and that set the stage for what we've witnessed since - one of the best performing stocks for two years running.
NFLX has had its periods of ho-hum action and even breakdowns, but each such period has been followed up with that "exclamation point" move back to the upside. Check out the next two charts, one in 2009 and one in 2010, that shows the potential breakdowns and the explosive recoveries:
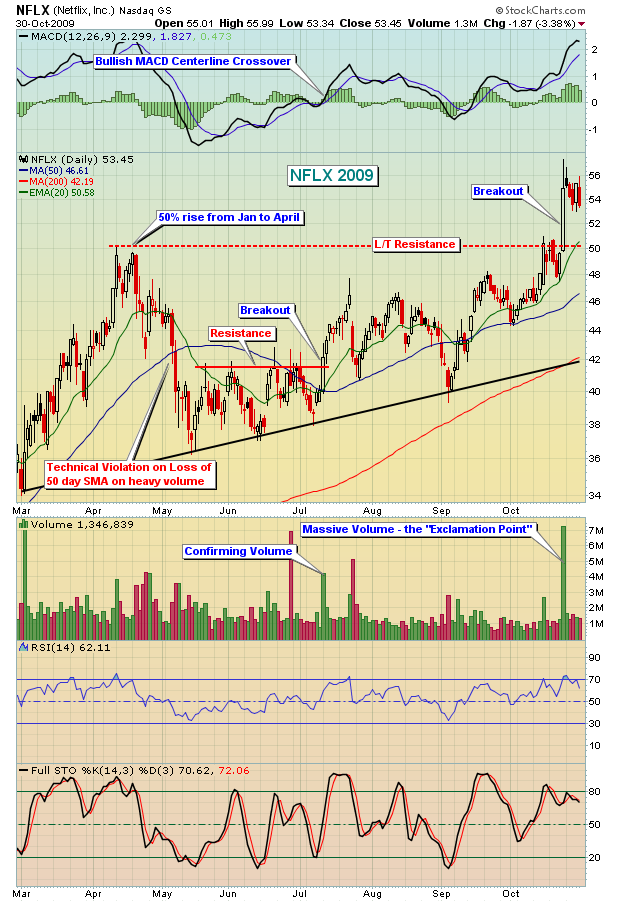
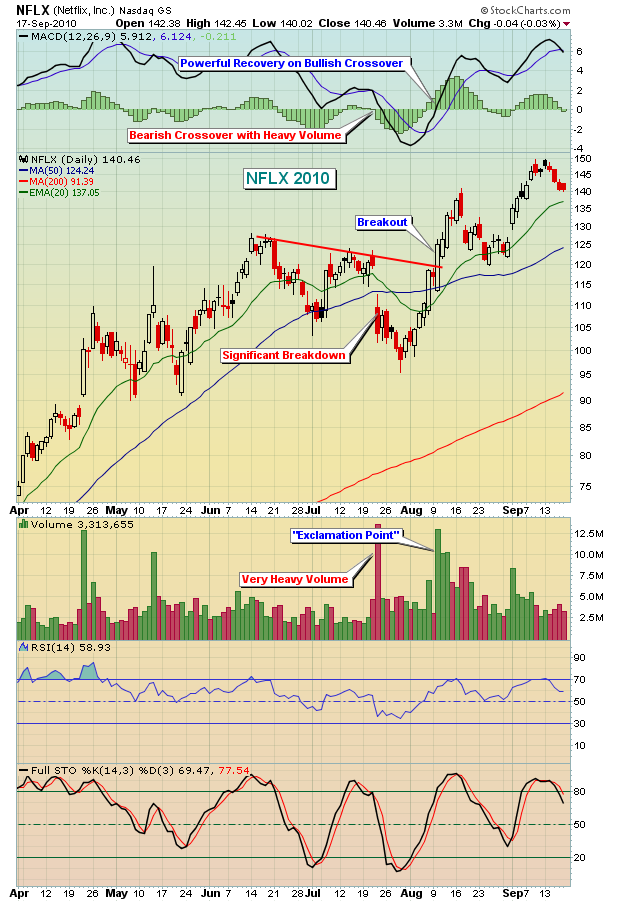
The truly strong stocks don't leave you wondering whether a move is for real. It's evident with exclamation points on the chart. The combination of price action and accompanying volume is BY FAR my #1 indicator. It trumps everything else. Institutions cannot accumulate stocks without volume spikes and stocks cannot become superstars without price appreciation. The two go hand-in-hand.
For Monday, September 20, 2010, we're featuring a small cap stock for our regular Chart of the Day that "could" be at the stage NFLX was back in early 2009. A bottoming head & shoulders pattern formed and an "exclamation point" was delivered on Wednesday with a retest of the breakout area on Friday. CLICK HERE for more details.
Happy trading!
The S&P 500 is square within the September/October "historically weak" time frame, but it has been nothing short of astounding to be sure...to the upside. We've seen a rally in 10 of the past 13 days, with prices now squarely upon major previous high resistance. And we believe the counter-trend rally in all probability ended itself in the wee hours of Friday morning's overseas trade with the S&P futures breaking out above the 1131 level...and promptly failing. If Friday hadn't been the "triple witching" of options and futures (we refuse to recognize "quadruple witching" given we know of no one person of institution trading single stock futures) - then a larger decline may have indeed developed. But this very well may change next week.
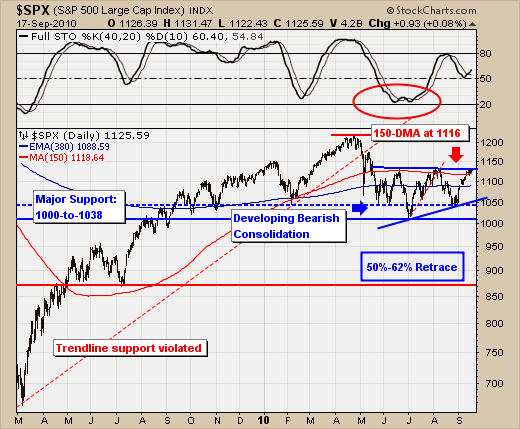
As for the technicals, there are several very clear patterns: 1) the bullish "head & shoulders" bottoming pattern everyone is pointing to at this juncture; and 2) the bearish consolidation after the sharp decline off the April highs. We vote with the latter given overhead resistance and the anemic volume of this current rally, although anemic volume doesn't seem to have the same technical cache it used given the high frequency trading dominates nearly 40% of the trading volume. Still, being classical technicans, we should see the rally fail at current to slight higher levels and for a sharp decline to develop into the historical October bottom. Our target is the 50%-62% retracement zone...which equates to roughly 880-to-940.
Hence, a rather well-defined shorting opportunity has arisen, and we've elected to being the process of adding short positions. As far as this setup is concerned...they don't come much better.