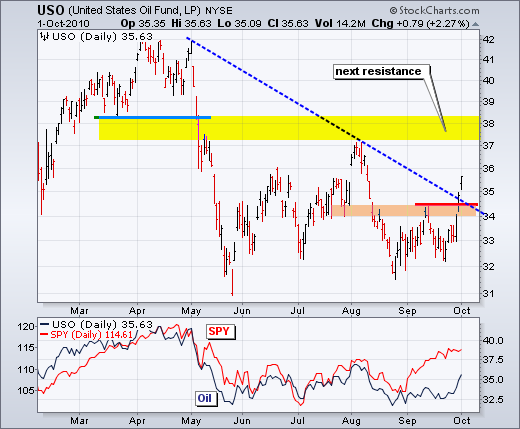
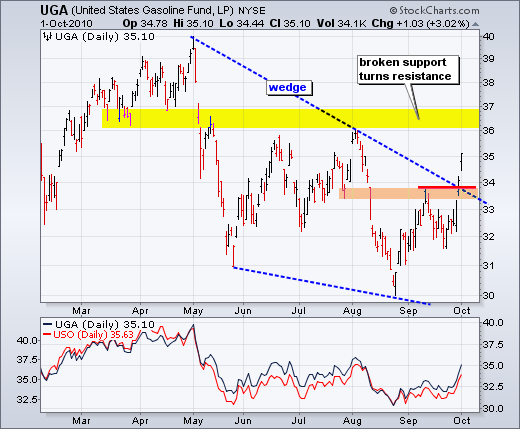
Oil finally started making up for lost time. Despite strength in stocks and weakness in the Dollar throughout September, oil remained below its mid September high the latter part of the month. Broken support around 34 turned into resistance and was holding. Things suddenly changed as the USO Oil Fund (USO) broke out with the biggest weekly gain since March. USO also broke above the May trendline. Broken support and the August high combine to mark the next resistance zone around 37-38. The second chart shows the US Gasoline Fund (UGA) following oil higher with a breakout as well. Broken support turns into the first resistance zone around 36-37.
According to the Investment Company Institute Annual Mutual Fund Shareholder Tracking Survey, shareholders' willingness to take "substantial or above average risk" has not recovered since the beginning of the financial crisis started in 2008. (Click here to read the entire article.) The chart below shows that there has been marginal recovery in two age groups, but overall risk tolerance is unchanged from last year, which was down from 2008.
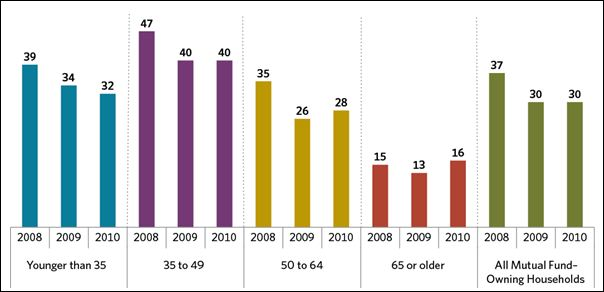
Source: ICI Annual Mutual Fund Shareholder Tracking Survey
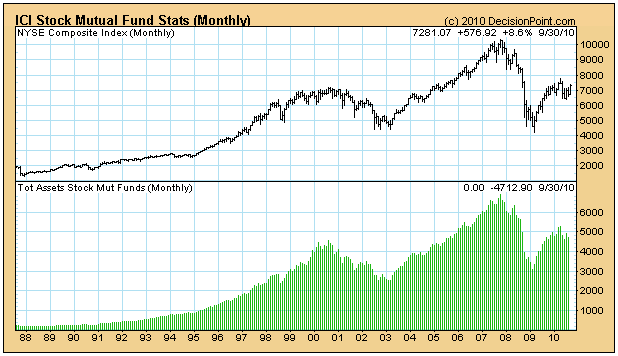
Faded risk tolerance, of course explains why mutual fund assets are well down from their 2008 high. To be sure, when investor tolerance for risk increases again and new highs in mutual fund assets are seen, another price top will surely be at hand.
The ICI article got me thinking about how the the traditional approach to risk is that we should be more aggressive when we are young, because we will have time to recover from any losses that result from high-risk investments. As we become older we should shrink from the risky antics of the younger set because time is no longer on our side.
In my opinion, this is one of the many flaws in the buy-and-hold logic. Risk has less to do with one's age than it does with the context of the market trend. Being invested when the market is in a bull market significantly reduces the risk no matter how aggressive an investment may seem to be, and even the most conservative exposure will still generate losses in a bear market.
To further illustrate this point we are fortunate that Rydex has three funds, started in 2006, that have conservative, moderate, and aggressive management styles. Review the charts, and we will resume below.
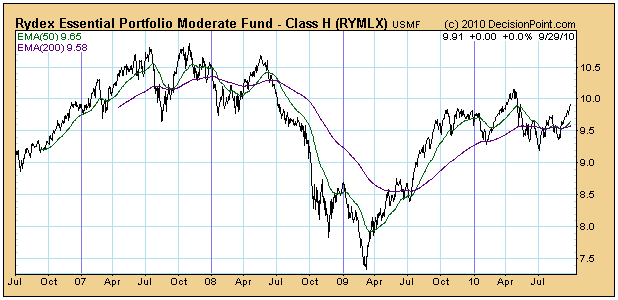
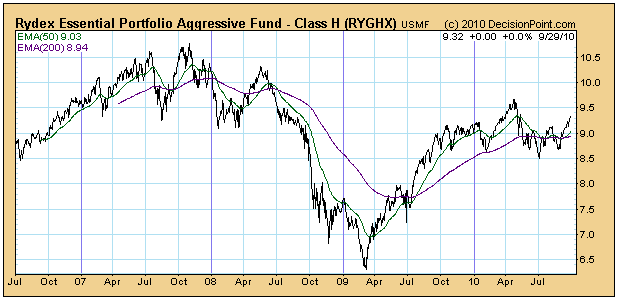
You will notice that the shape of the price indexes are very similar, but the results are quite different. To begin, let's look at the results from inception to 9/29/2010, then during the bear market beginning in 2007/2008, and finally the bull market from the 2009 low to the April 2010 top.

It is interesting that over a range of bull and bear markets, the conservative approach had the best return since inception, but, when we separate the bull and bear market performance, the returns are appropriate (what we would expect) to each approach. For example, the aggressive (most risky) approach loses the most in the bear market, and gains the most in a bull market. The obvious assessment is that, in a buy-and-hold world, there is really no significant benefit of one approach over another, just that the aggressive approach results in more volatility.
While at first glance it may appear that, during the bull market, all approaches have regained slightly more than they lost during the bear market, remember that a 100% gain is needed to recover a 50% loss.
Bottom Line: Using a particular strategy (conservative or aggressive) is not as important as when it is used, and I don't mean whether you are young or old. It is most important that bear markets be avoided and that bull markets be exploited. Using an aggressive strategy during a bull market will carry far less risk than using a conservative approach during a bear market.
Great question. There are as many arguments saying "no" as there are those saying "yes". Who do you believe? In August, our major indices were tumbling and it seemed like every media outlet was touting our doom and gloom. By the end of September, psychologically it seemed like a completely different market. There are a ton of reasons to like the market to keep doing what it's been doing. Price action has been superb. The Moving Average Convergence Divergence (MACD) is based on price and the divergences are solid across all timeframes. Those weekly MACDs, which looked so ugly back on those April highs, suggested a rough summer ahead and that's what we saw. Currently, however, the MACDs on the weekly timeframes look super. They've all crossed back above the centerline and are pointing straight up. This tells us that bullish momentum will support higher prices.
But price action is only half the story. The other half is big too, and that's the side that deals with volume. I love the analysts who try to make excuses for the market and tell us that this time it doesn't matter and then proceed to lay out all the reasons why. VOLUME ALWAYS MATTERS. Don't let anyone tell you otherwise. It's the combination of price and volume that matters. Neither one without the other can be relied upon - in any market. So exactly what kind of what volume matters? Well, this is where judgment is involved. I'll be the first to say that you won't see the same type of volume during periods of market strength that you'll see during market selloffs. Fear is a very powerful emotion, one that makes most of us do things we wouldn't ordinarily do. And when fear involves the loss of money, really strange behavior takes over. The acceleration of volume during periods of panic will never be matched by the acceleration of volume during periods of market ascent. In other words, we shouldn't be looking for the type of volume we saw in May (during the flash crash) to confirm the recent market strength. It's very, very unlikely to happen. We should see above average volume though.
I spoke for weeks about the importance of 1131 resistance on the S&P 500. That was the June reaction high. In August, the S&P 500 rose to intraday highs between 1120 and 1130 on 7 consecutive days without once trading above 1131. In September, we saw five more consecutive sessions approach 1131 without a breakthrough. On September 20th, the sixth consecutive intraday attempt at 1131 finally worked. 13 times we tried to penetrate 1131 and we failed. The bulls tore down what appeared to be an impenetrable wall of resistance. Every technical analyst I follow talked about the importance of 1131 resistance. Given that this major level of resistance was lifted, the short covering would begin in earnest, right? Cash on the sidelines would finally pour in, right? Hardly. A summer's worth of resistance was taken out on......3.4 billion shares on the S&P 500. Let's put this in perspective. The average daily volume on the S&P 500 during September prior to the 20th was 3.7 billion shares. The average daily volume on the S&P 500 during August (a very slow month for equities historically) was 3.9 billion shares. The "long-awaited" breakout after 13 failed attempts occurs on 3.4 billion shares and we're supposed to be ok with it? Pardon me, but I can't get excited by the action.
I view the lack of volume as a negative and a signficant red flag. It doesn't mean I'd be shorting. We do have to respect the price action. The market is sending me loads of mixed signals and they're not all related to price/volume. Consider sentiment for a moment. I like to follow the VIX and the equity only put call ratio. The latter rose to extreme levels back in April and that made it easier to call a top. Currently, the action in options is quite boring, if I'm being honest. There are no impending signs of a market top and that may be one of the reasons September was such a strong month. It's hard to imagine that few would trade equity calls given the straight up move in September, but the facts speak for themselves. Leading up to the April 26th top, the equity only put call ratio averaged .47 month-to-date in April. During that same period, an average of 1.95 million equity call contracts were traded each day. Now let's fast forward to today. During September, the equity only put call ratio averaged .58 and an average of 1.13 million equity call contracts were traded each day. Does that sound like a complacent market that's ready to reverse big time to the downside? Nope, not to me either. The VIX, on the other hand, is more bearish. Despite a significant rally in equities during September, the VIX finished the month slightly below where it was on September 2nd. Ordinarily, the VIX moves inversely to equities. While equity prices were rallying strongly throughout the month, it seemed as though VIX traders weren't buying into it. The VIX has stubbornly remained in the 21-24 range. The message that sends to me is traders are looking for increasing volatility down the road. Increasing volatility is associated with weakening equity prices. So should we follow the equity only put call ratio and its flippant attitude or the lack of bullish behavior in the VIX? The VIX is included as our Chart of the Day for Monday, October 4th. CLICK HERE to see how the VIX is failing to confirm the bullish market action of late.
There's one really big problem this rally faces in my opinion, and it's the poor relative performance of financials. The financial group should act much healthier in an improving economic environment. Money should be flowing TO the group, not AWAY from it. While the media outlets would have you believe our economy is on the improve, and many economic reports would confirm this belief, the lack of money flowing to financials while an exorbitant amount flows to bonds simply doesn't support this argument. It's as if Wall Street is telling us one thing and doing the opposite. They wouldn't do that, right? If banks and other financials aren't technically as strong as the remainder of the market, I have problems buying into the improving economy theory. Sorry. Look at this chart:
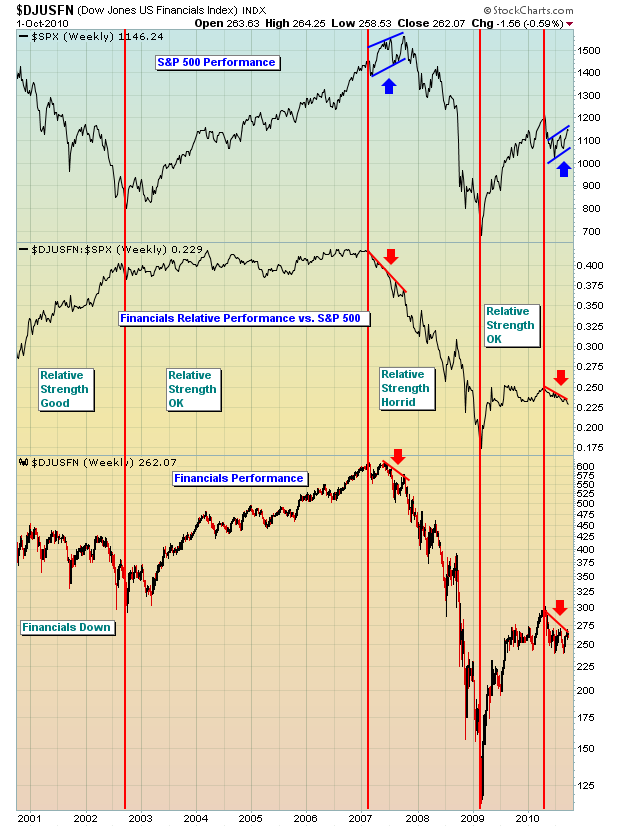
In my view, when the financial sector is falling and its relative strength is also falling at the same time the overall market is rising, it's a MAJOR warning sign. We saw it in 2007 just before the market began its most recent bear market. We also saw the relative strength of financials weaken in April as the market neared a significant intermediate-term top. Currently, we have the market rising while BOTH financials AND their relative strength are dropping. I can't help but be cautious is this type of environment. If I leave some money on the table, then so be it. When it comes to preservation of capital, cautiousness always prevails over greed.
The price action remains bullish and we'll continue to do what we've been doing at Invested Central. That's trading fewer shares, mostly on the long side for now, but with both eyes fixated on the exit sign. If you adamantly wish to remain on the long side, consider hedging strategies to minimize risk. It wouldn't be prudent to trade this market without insurance.
Happy trading!
The S&P 500 rally off the late-August lows continues apace, although it would appear that it is stalling and a correction at a minimum is warranted. There are many who point to the 200-day moving average breakout and the "head & shoulders" neckline being pierced to the upside as being sufficient to call for higher and higher targets - a new bull market in full bloom. However, while these are major technical pattern breakouts to be sure, but they come under less-than-ideal circumstances as they haven't been confirmed by the OBV "on-balance-volume". We would look to this indicator for confirmation of the breakout, for OBV did indeed lead the S&P higher with its early-March breakout. It has not thus far, and we find this troubling.
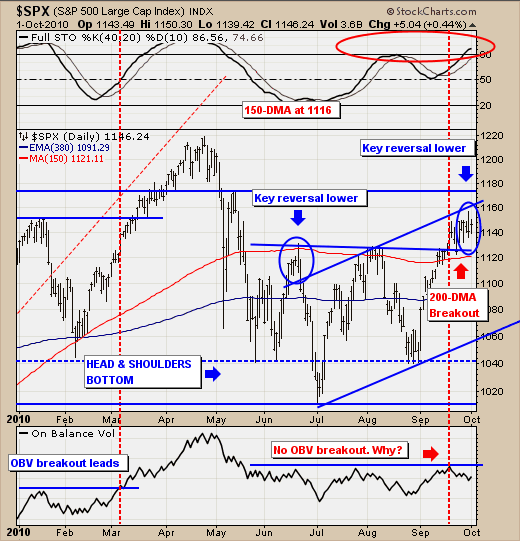
Given this non-confirmation, then we would turn to the developing bearish consolidation from May-to-Present as the overarching technical pattern, then point out the recent key reversal pattern to the downside that denotes exhaustion of the current uptrend. If we are right, then we'll get a minimum correction towards rising trendline support at 1060. However, we would further view this as doing excessive technical damage given the invalidation of the 200-day moving average and "head & shoulder" neckline breakouts. This would increase the probability of the bearish consolidation projecting lower lows towards 950. Moreover, were weakness were to develop from current as expected; it would turn the 40-day stochastic lower...further confirming weakness.
Therefore, while others look at sunshine ahead - we see clouds on the horizon, which has pushed us to the sidelines and a modest short position. We'll look to build upon it as prices invalidate the aforementioned breakouts. One should consider battening down the hatches at this juncture.