Hello Fellow ChartWatchers!
Another year has come and gone. It seems like only yesterday that we were celebrating the start of the decade (heck, it seems like only yesterday we were celebrating the start of the new millennium!)
This year one of the things we focused on here at StockCharts we to increase the value of a StockCharts.com membership. In order to see how we did, consider the following mythical subscriber, Fred.
Fred is an average investor who trades several times a month, owns about 10 stocks/funds, tracks about 200 different charts, and enjoys seeing real-time data. Fred likes to keep up with what technical experts are saying about the market too. He's knowledgable about charting, but doesn't consider himself a T/A expert. "There's always more to learn" is his favorite saying. Fred is watching his budget and doesn't want to overspend for anything so he prefers paying on a month-to-month basis.
Fred joined StockCharts in November of 2008 by subscribing to our ExtraRT+Market Message service. At that time, ExtraRT gave him Real Time data and the ability to store more than Basic's limit of 100 charts. Fred also wanted to read John Murphy and Arthur Hill's commentary. He subscribed on a month-to-month basis for a cost of $45.90 per month.
By the end of 2009, Fred had spent $642.60 for 14 months of our ExtraRT+Market Message service. He was happy with what he got but was looking for ways to lower his cost and increase his value.
Let's see how Fred got his wish in 2010...
In January of this year we introduced our Free Real-time service using data from the BATS exchange. No more 20-minute delay on US stocks for non-ExtraRT subscribers! Because he didn't need super-accurate real-time quotes, Fred immediately downgraded his account to our Extra service and lowered his monthly cost to $35.95.
In April Fred was really happy to see us add the "Inspector" feature that allows him to move his mouse over any chart and see the data values for any bar.
Though initially skeptical when we launched our new Facebook page in July, Fred gradually became a fan and he now enjoys the contests and giveaways we have there as well as the tips, quotes and article notifications.
In September Fred was thrilled to see our new YouTube video area open up. He learned a lot of things he didn't know about his account from the "Getting Started with StockCharts" video and was able to re-organize his ChartStyles to greatly improve how he reviews his saved charts.
In October Fred was happy to see all of the new features that we added to the ChartNotes annotation program. The Elliott Wave notation tool was his favorite, but he was happy to get all the new tools for no additional cost.
In November Fred was amazed to see that our Basic service had gained most of the features that he cared about: real-time data via BATS, up to 500 stored charts, up to 20 stored ChartStyles, and the ability to store annotated charts! Fred immediately downgraded his account to the Basic + Market Message service lowering his monthly cost to $27.49(!).
On December 3rd Fred read on our Facebook page that the Market Message had just been made free for all subscribers. He couldn't believe it. That automatically lowered his monthly cost to $14.95. He was now paying $30.95 LESS than what he was paying at the start of the year. That's about 66% less than before! But wait, there's more...
This week Fred wised up and stopped subscribing on a month-to-month basis. Just yesterday Fred placed a 12-month order during our current Holiday Special. That got him 14-months of service for $154.59 - a cost of just $11.06 per month. That's 75% less than what he paid at the start of the year!
Finally remember that Fred paid $642.60 for 14 months of service prior to the start of 2010. Now, he's paying just $154.59 for essentially the same capabilities. Fred is beyond thrilled to see that his costs have gone down over $488 this year. He can't think of anything else in his life that has had such a big increase in value.
Now, not everyone is in the same situation as Fred. The cost savings this year will vary from member to member depending on the kind of service they need and the payment flexibility that they want. But the bottom line is this:
In 2010, the value of a StockCharts.com membership increased significantly as many more features were added and charting packages were consolidated.
Our goal is to continue to increase the value of a StockCharts subscription in a huge variety of ways. We can't wait to see all the great new features that 2011 will bring.
Happy Holidays to you and yours from everyone on the StockCharts team!
- Chip
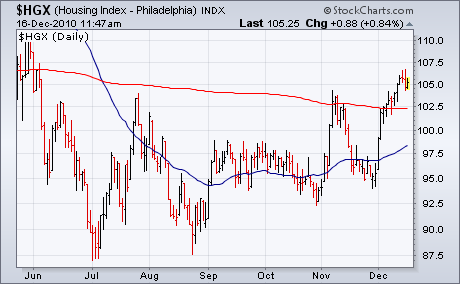
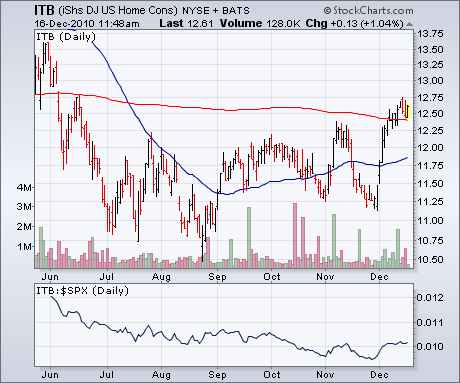
We have written several messages of late about the recent upturn in financial stocks that had been lagging behind the rest of the market since the spring. I expressed the view that a sustained upturn in the stock market was unlikely without some help from the financial sector. Fortunately, financial stocks have finally turned up and have actually shown market leadership during December. Another market group that's been weighing on the overall market has been housing. And even that sector is beginning to show some improvement. The first three charts show three measures of the housing sector and all three have risen to seven-month highs after clearing their 200-day moving averages. Chart 1 shows the PHLX Housing Index (HGX) having broken through its July/November highs. Chart 2 shows the S&P Homebuilding SPDR (XHB) breaking clearing its November high on rising volume. Chart 3 shows the Dow Jones US Home Construction iShares (ITB) having just cleared its 200-day line. The relative strength lines below Charts 2 and 3 actually show a little leadership during the month of December. I'm not necessarily expecting housing stocks to show much upside leadership. Any signs of strength in that group, however, should be a further hint at an improving economy and a stronger stock market.

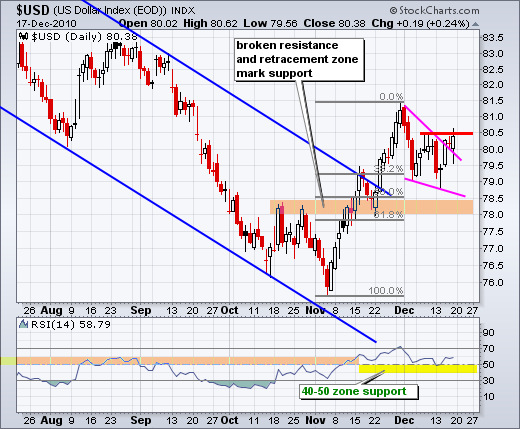
The US Dollar Index ($USD) remains within a long-term trading range, but the swing within that range is up after the November breakout. More importantly, the breakout is holding and rising rates are boosting the greenback. The first chart shows the US Dollar Index with resistance in the 88-89 area and support in the 74-76 area. There are also three big swings on this chart marked by the blue trendlines. With the recent surge above 80, the index broke the June trendline to start an upswing within this trading range. The indicator window shows the Dollar and the 10-year Treasury Yield. Notice how the yield bottomed ahead of the Dollar and moved sharply higher the last 2 1/2 months. Despite problems with the deficit, rising rates are a positive influence on the Dollar. The second chart shows the US Dollar Index breaking a wedge trendline and challenging resistance around 80.50 this week.

Click this image for a live chart
Bonds are in a "waterfall" decline, and some people are beginning to wonder where the bottom will be. A subscriber comments: "I'm always anxious to see the reaction time of the DP Trend Model as compared to what I look for in the momentum of the primary trend. You're doing a fine job with equities explaining what you see when you look at the other indicators and would love to see you give a little more attention to the bonds. I'd be able to follow what indicators you use to evaluate the oversold point in this waterfall. Yes, I'm aware of the falling knife adage and would not go long but rather stop being short. Perhaps go short after the relief rally. Depends on where the dollar is in it's move as well."
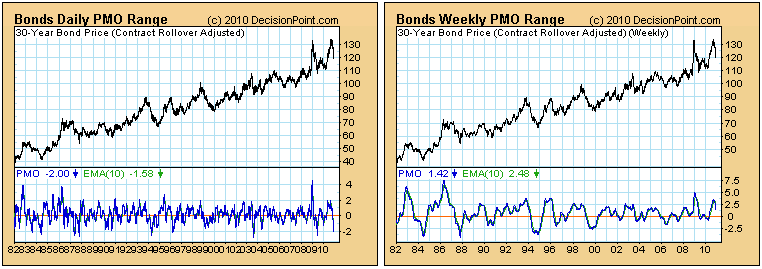
To begin let's estimate overbought/oversold conditions. Below are two charts that show the daily and weekly PMO in relation to their 30-year ranges. The daily PMO (on the left) is clearly at the bottom of its normal range and is oversold. It still has room to go lower, much, much lower, but it would be reasonable to start looking for a price bottom. The weekly PMO, however, has topped in overbought territory and has plenty of room to go downward before it becomes oversold. Conclusion: A medium-term bounce is possible, but the longer-term decline has a long way to go.
Next, let's take a look at the daily chart, which is where we get the best view of the Trend Model components -- the 20-EMA and 50-EMA. The model will generate a buy signal when there is a 20/50-EMA upside crossover, and I can tell you that, while price will probably turn on a dime, the Trend Model will not. It is going to take a lot of upside movement to get the model to turn when the down trend is this accelerated.
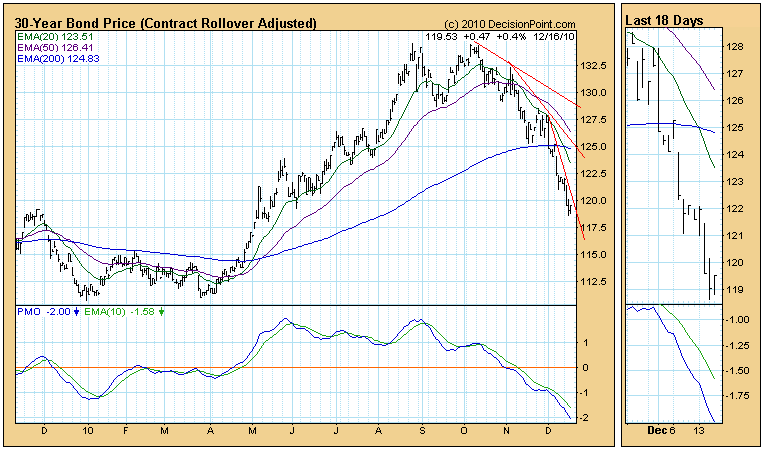
The model is currently in neutral, so we don't have to worry about being short and getting caught in a vicious upside reversal, but for those who are short, the problem is when to cover shorts, not when to go long. Two possible signals that could be used are (1) when the PMO turns up, or (2) when the steepest declining tops line is penetrated to the upside.
As I said, the Trend Model will be slower to generate a buy signal than some people will like. For those managing positions in the short term, two possible buy signals are (1) the PMO crossing up through its EMA, or (2) the 5-EMA crossing up through the 20-EMA. The 5/20-EMA relationship is something we are going to be paying closer attention to in the future, so let's take a look at a short-term chart.
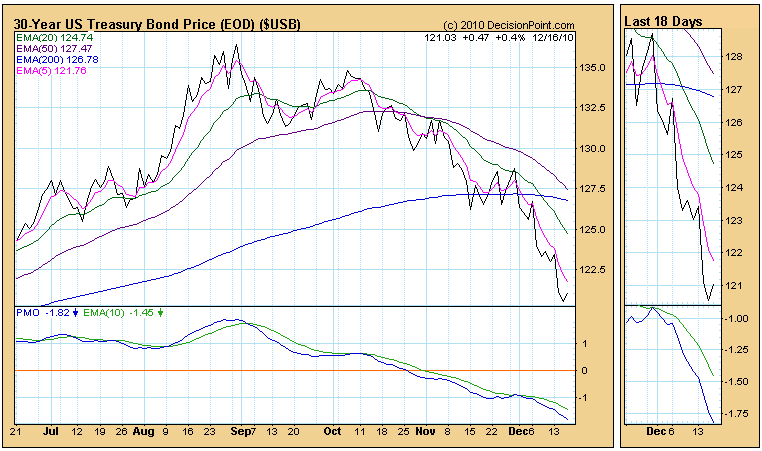
The movement of the 5-EMA can provide a clear picture when the PMO is presenting a fuzzy one. Note how it remained above the 20-EMA during the June/July/August period, while at the same time the PMO was inscrutable. PMO signals during that time were not helpful at best, but the 5-EMA said "stay long".
As for a 5/20-EMA buy signal for bonds, the amount of separation between the moving averages tells us that it will still take a lot of rally before it happens, so it won't be the most timely of signals. This is always a byproduct of steep declines.
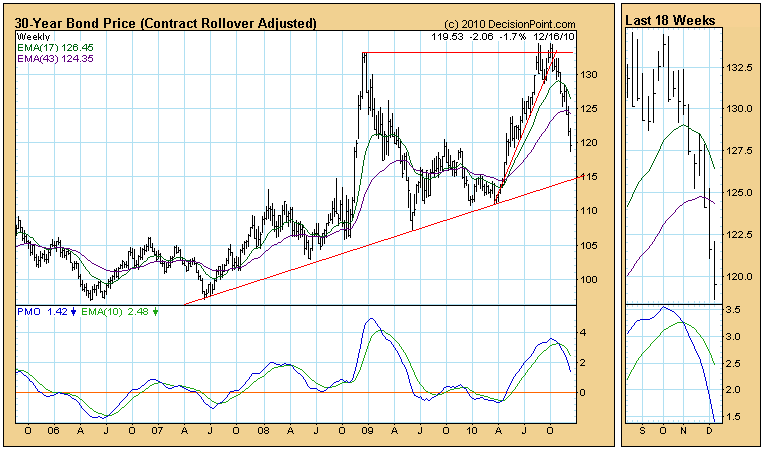
The weekly chart shows long-term support on the rising trend line drawn from the 2007 lows.
But the monthly chart shows the very long-term support on the rising trend line, as well as the potential downside if that support is broken.
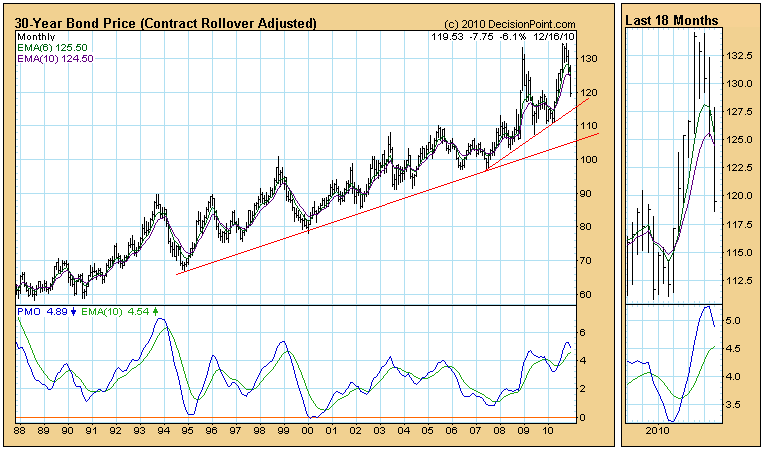
Bottom Line: Bonds are in a long-term bear market based upon the fact that the 50-EMA is below the 200-EMA. The current steep decline is subject to being reversed rather abruptly, so shorts should have a plan to cover quickly; however, I don't think that the long-term decline is over, and I wouldn't be anxious to be long on other than a short-term basis.
It's hard to believe another year is coming to an end. Outside of a few scary weeks, the stock market performed well in 2010 and heads toward 2011 with a lot of bullish momentum. Complacency is a short-term issue that we dealt with last week and will continue to have to deal with in the near-term, but history is on the side of the bulls. During the last 10 days of the year, the NASDAQ has produced annualized returns of 68.29% since 1971. 68% of the days that fall within this 10 day period have been higher over the last 40 years. Those are compelling numbers that shouldn't be ignored. This period contains the days that make up the "Santa Claus Rally" from the Christmas holiday through New Year's Day. Since 1971, the odds of any day moving higher on the NASDAQ is roughly 55%, so this period's 68% is substantially above the norm and worth noting.
As we approach the end of the year, it's a good time to assess what worked for you in 2010 and what didn't. We should all be prepared to alter our trading styles and strategies to encourage more successes in 2011 and beyond. I'd like to offer up four New Year's trading resolutions for 2011. While these aren't designed to be the only resolutions that you should incorporate, they are four that I believe separate successful traders.
1. DON'T CHASE STOCKS:
Sounds easy enough, right? After all, at what other point in your life do you wait for prices to rise before buying? Probably everyone who's ever traded a stock has made this costly mistake. Sure, there are the Apple's (AAPL) of the world that never seem to pull back that reward this type of risky behavior, but the masses of stocks do not. Common sense should prevail here but, at a minimum, check out the RSI and stochastic on a stock and avoid buying when readings are in the 70s and 90s, respectively. Allow uptrending stocks to relieve overbought conditions. Buying these stocks into weakness - so long as there's been no significant technical deterioration - will improve your trading results while limiting your risk.
2. EXPAND YOUR HORIZON OF STOCKS:
There's no need to limit yourself to one, five or ten stocks. The StockCharts scan engine makes it incredibly easy - in minutes - to uncover a large number of trading candidates that meet certain criteria - your criteria. I see traders trying to force trades all the time, attempting to get into their favorite stock, and doing so at inappropriate technical times, and at their own expense. There are literally thousands of stocks across the major exchanges, so there's no need to focus on just a few.
3. IMPROVE YOUR RISK/REWARD STRATEGIES:
Enter every trade with a plan and stick to it. Understand first who you are as a trader. Do you like to daytrade? Do you prefer swing trading? What is your risk tolerance level? Everyone has a unique style and situation. As a result, what might be a great entry point for a swing trader may turn out to be a not-so-good entry for a daytrader. A trader with a low tolerance of risk might find that trade far too risky. The key here is to know why you're entering a trade, what it would take for you to exit (stop loss) and an appropriate target. These should all be determined BEFORE you enter the position. Many unsuccessful traders have one or two of these criteria figured out before they enter the trade. It's the third one that derails them.
4. REMOVE THE EMOTION:
I'm sure most of you have heard this before. This one sounds easy too, until you start losing money. Then fear creeps in and you begin altering your plan, assuming you had one in the first place. All of a sudden, you begin to alter your stop loss lower in order to allow your position to "recover". It usually results in good money wasting away in a weakening stock. This is a serious trading crime as you violate the theory of keeping losses to a minimum. But that's not the only emotional disorder we suffer. Greed can be even more powerful and disastrous. Greed results in many problems, but there are two problems that immediately come to mind - position sizing and failing to execute and take profits when your original plan works perfectly. Incorrect position sizing can occur for a number of reasons. One is trying to "catch up" after a loss. You figure if you play twice as many shares as appropriate, then you can recover prior losses quicker. This type of thinking may work on occasion, but many of us have felt the despair as losses only deepen. Another example of incorrect position sizing occurs after a trader has correctly called several trades in a row. Overconfidence breeds greed. It's not easy, but we must remain grounded. Those who can develop and execute a plan with little interference from fear and greed will produce better results over the long-term.
I try to address these resolutions every single day in our Chart of the Day. I don't guarantee their success. I never have and never will. But I can justify the risk/reward on each trade, discussing the type of trader that might benefit from them. Occasionally, I feature a very aggressive small cap stock that might appeal to those traders who enjoy taking big risks for the potential of bigger returns. Other times, I might feature a Dow Jones component that allows traders - who are looking for capital appreciation and limited risk - to sleep at night. There is one common thread to every one of them - education. I try to learn something new every single day and you should too. CLICK HERE for my Chart of the Day for Monday, December 20.
I will also be providing my 2011 Stock Market Outlook on Tuesday, December 21st at 4:30pm EST. For more details, and to register, CLICK HERE.
Happy trading, Happy holidays, and HAPPY NEW YEAR!!!
Happy Holidays!
The recent rally off the late-August low has begun to encounter sluggish internals, which leads one to believe that the market shall be poised correct in the weeks and perhaps even months ahead. To this end, we should note the CBOE Volatility index or VIX has moved sharply lower back to levels previously consistent with trading highs in the S&P 500. Moreover, the 20-week stochastic is at oversold level further consistent with a turn higher as it eventually always does. This leads us to believe that a 200-week moving average mean reversion exercise can't be too far in the offing, which would put the VIX back to the 25-level - which would further suggest just a small nasty correction in an ongoing bull market. However, a breakout above this level would suggest a much larger decline is underway.
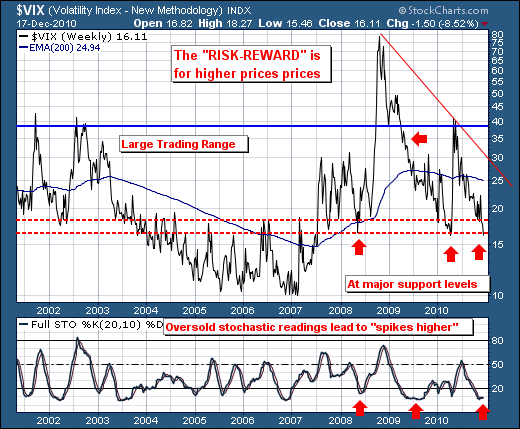
In layman's terms, while this doesn't prevent the VIX from moving lower and the S&P higher - it simply illustrates that the risk-reward dynamic has now changed to more "risk" in chasing this rally. At the Rhodes Report, we are looking for a trading high near current levels, and are deploying capital to taking advantage of any decline.
Good luck and good trading,
Richard