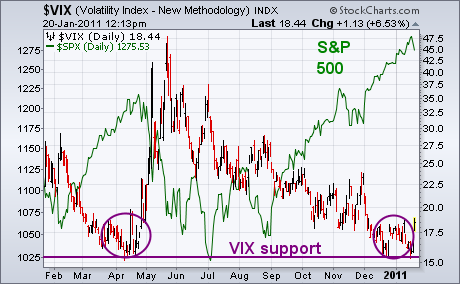
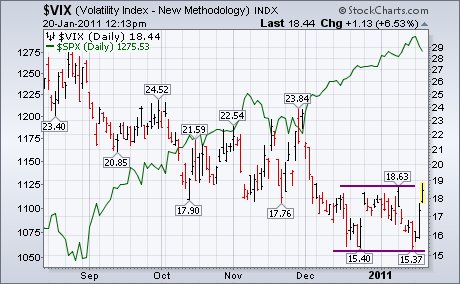
Two Thursday's ago (January 6), I showed the CBOE Volatility (VIX) Index having reached a potential support level at last spring's low near 15, and warned that a bounce off that level could cause a stock market pullback. That's because the VIX and stocks usually trend in opposite directions as shown in Chart 1. The reason I'm coming back to the VIX today is because it's climbing 8% and beginning to look like it's short-term trend is turning up. Chart 2 shows the VIX action more closely. After bouncing twice off support near 15 since mid-December, the VIX is challenging its early January intra-day high at 18.63. A close over that initial resistance barrier would turn its short-term trend higher and could signal an overdue pullback in the stock market.
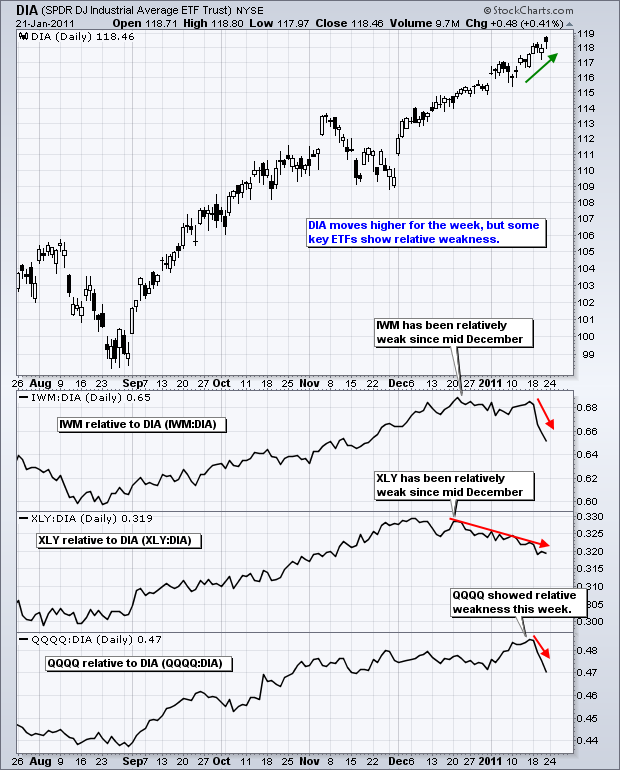
The Dow Industrials SPDR (DIA) led the market this week with a new 52-week high on Friday. Not bad considering the Russell 2000 ETF (IWM) suffered its biggest weekly loss since early August. Overall, the up trends for the major index ETFs remain in place as they recorded new 52-week highs this week. The Russell 2000 ETF (IWM), S&P 500 ETF (SPY), S&P MidCap 400 SPDR (MDY) and Nasdaq 100 ETF (QQQQ) recorded their new highs at the beginning of the week, but peaked on Wednesday and were down for the week. Led the strength in IBM on Wednesday on General Electric on Friday, DIA finished the week on a strong note.
Click this image for a live chart.
Despite strength in Dow Industrials SPDR, the Russell 2000 ETF and the Consumer Discretionary SPDR have been relatively weak since mid December. The chart above shows the Price Relatives peaking in mid December. The IWM:DIA took a major hit this week and moved to its lowest level since late November. The XLY:DIA Price Relative has been working its way lower the last five weeks. The QQQQ:DIA Price Relative also took a hard hit this week. Even though DIA is doing its part, relative weakness in small-caps (IWM), the most economically sensitive sector (XLY) and large-techs (QQQQ) cast a shadow on this weekâs rally.
In my business I am exposed to the writings of a lot of really smart people, and it is never hard to find a few who are trying to explain to us why the market is wrong. The market is wrong, of course, because it has blithely gone its merry way without any regard for the brilliant analysis, presented by the writers -- analysis that explains with exquisite detail and flawless logic why the market should be doing the exact opposite of what it is doing.
Fundamental analysts are most prone to this kind of error -- writing reams of research, and then, by god, sticking to their guns as the market in turn puts them and their investors through a meat grinder. Most are trapped in a system where they are required to justify their actions with a good fundamental story, which is why, for example, Calpers (the State of California retirement system) was down 25% in 2009.
However, there are plenty of technicians who fall into the same trap when they start using indicators and oscillators as a crystal ball. This approach usually doesn't work any better than the fundamental crystal ball. You are basically left with a bunch of ambiguous technicals as a basis for making your next "call."
Rather than explaining why the market is wrong, we should be asking, "What is the market doing?", and acting appropriately. I am, of course, talking about a trend-following discipline. This approach is never perfect, but it is always rational because we respond to what prices are actually doing, not what we think they ought to be doing.
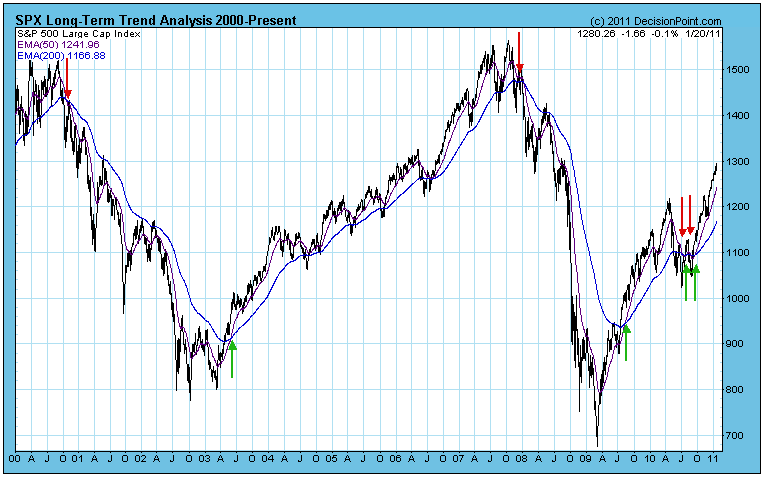
This article is not intended to explain our entire Trend Model methodology, just to plant a seed that maybe following the market is better than telling the market where it should go. Below is a chart displaying our Long-Term Trend Model. It generates a buy signal (green arrow) when the 50-EMA crosses up through the 200-EMA, and a sell signal (red arrow) when the opposite occurs. As you can see, it has been very timely and effective for most of the eleven years shown. You can also see imperfection when we got some whipsaw signals in 2010. Whipsaw is painful, but not nearly as painful as being caught on the wrong side of the market for an extended period. I just think of it as a cost of doing business. (The long-term component of the Trend Model is on a BUY signal as of 9/17/2010.)
There is another positive aspect to committing to a trend-following discipline in addition to ease of decision-making. When you are making discretionary decisions based upon some fundamental or technical theory, you are inevitably faced with having made a "call" and having the market go against you. What to do now? Change your position and risk whipsaw? Hang tough and hope the the market finally goes your way? Been there, done that. With trend following, your decisions are made for you, and position changes are based on objective reasons.
Unfortunately, most money managers do not use the trend-following methodology. Fortunately, it isn't hard to do, and you can do it yourself with not a lot of effort.
We have created a series of charts for our subscribers that specifically addresses the 20-EMA and 50-EMA relationship going back to the 1920s. You will see, as I said before, that it is not perfect, but you can also see that it is always adjusting to changing markets, and is overall very effective.
It is important to note that the 50/200-EMA model is used in our work to establish the long-term context of the market -- bull market or bear market. It responds slowly and will not react quickly enough to avoid something like the 1987 Crash. Our standard Trend Model is designed for shorter timeframes.
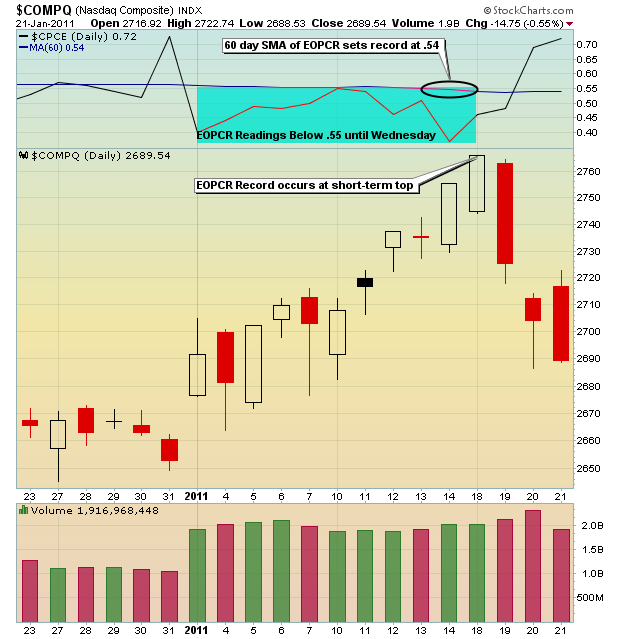
Complacency in the market was setting records this past week. The technicals? They look great. But can the market keep moving higher short -term when options traders are betting on it en masse? Well, maybe, but if you enter stocks on the long side at this level, please understand the risk bar has been raised significantly. Don't misunderstand my message. I'm intermediate-term to long-term bullish and have been that way since shortly after the bottom formed in March 2009. There have been short-term periods, however, when it's made sense to take a more conservative approach to trading. ANY time complacency grows, I get nervous. Why? Because market makers are VERY good about making money and they do it at the expense of you and me. As more and more folks trade call options on a relative basis, the odds grow that a near-term top is fast approaching.
Tons of net call option premium evaporated the last three trading days. The NASDAQ lost 3% of its value from Wednesday's open to Friday's close and that shouldn't surprise anyone who follows max pain, which I define as the point at which in-the-money call premium equals, or offsets, in-the-money put premium. It's generally in the market makers' best interests for prices to gravitate towards max pain into option expiration Friday. So between the complacency and max pain, the bulls faced a huge short-term hurdle as January options expired Friday. Unfortunately for the bulls, the market makers won again. In my view, it's another form of TARP for the financials. The good news for the Goldman Sachs of the world is that this TARP money doesn't have to be repaid. Wonderful! (sarcasm intended)
Since 2003, the CBOE has been providing information relating to the equity only put call ratio (the "EOPCR"). The average daily EOPCR since 2003 is .65. The 60 day SMA of the EOPCR is at .54. This is the lowest reading for this 60 day SMA on record. The first such reading occurred on Tuesday. Take a look at a one month chart on the NASDAQ:
Our trading strategy is to build cash during market advances where complacency reaches record or extreme territory. Attempting to short the market can result in pain as overbought conditions can typically remain overbought for a period of time. So as risks increase on the long side, we simply choose to take profits and use any weakness to re-establish positions. My latest educational feature at Invested Central is the Anatomy of a Trade where I detail recent trades issued to our members to provide insight into our risk management style and strategy. A well thought out plan of entry and exit points BEFORE the actual purchase is critical to trading success in my view. To view my latest Anatomy of a Trade, CLICK HERE.
Happy trading!
The recent rally in the broader stock market has begun to correct; and it shall likely correct for the next several weeks. We view this decline much in the same manner as the Jan-2010 to early Feb-2010 decline, which the S&P lost roughly 106 points or nearly -10%. Certainly our momentum models are turning lower, and now we view the VIX as a confirming indicator that perhaps has higher prices in mind than anyone is prepared for at this juncture. But at this point, we view any decline in stocks as transitory prior to perhaps a larger high in the 2nd quarter.
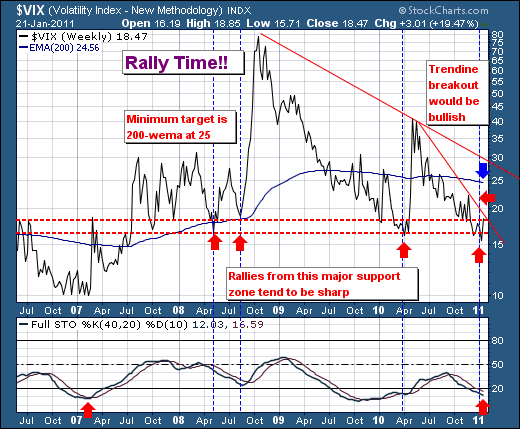
To wit, the weekly chart shows major support at the 16-to-18 zone is holding once again, and has for all practical matters back to mid-2007. This is reasonable, and one could very easily note once the VIX turns higher, then it generally "spikes" higher. If that is the case here, and the probabilities do favor such an outcome - then minor trendline resistance at 19 should be taken out. This would argue for a 200-week exponential moving average mean reversion exercise that would carry prices upwards to 24.56 or even slightly higher. At that point, quite obviously the technical landscape would need to be reassessed, for further gains would put the declining trendline off the 2008-to-2010 highs into play, and we fear what a breakout above this level would mean to stocks and the US economy in general.