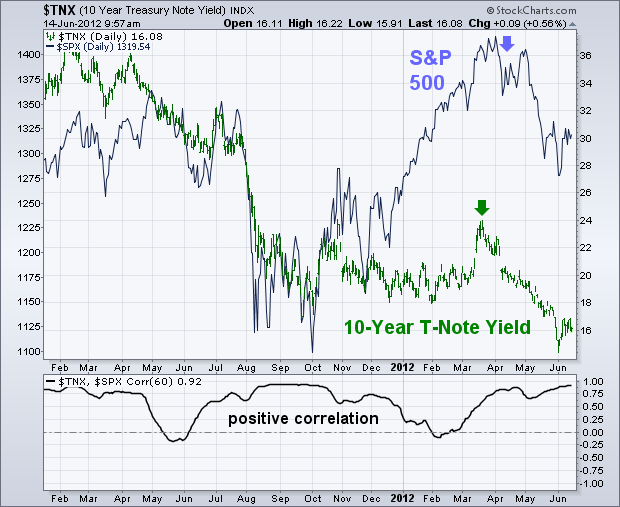
My Tuesday message showed falling commodity prices weighing on stock values. The same is true with Treasury bond yields which have fallen to record lows. Falling bond yields are symptomatic of economic weakness. Chart 1 compares the yield on the 10-Year T-Note (green bars) to the S&P 500 since the start of 2011. There's a positive visual correlation between the two markets, which is confirmed by the 60-day Correlation Coefficient (below chart). The current correlation is a very high .92. Falling bond yields during the first half of 2011 led to a stock market correction over the summer. Both bottomed together at the start of October. After that, stocks rose while bond yields stayed generally flat. Notice that a drop in the bond yields in mid-March led to a peak in stocks a couple of weeks late. Both have fallen together since then. The chart suggests it may take a higher bond yield to support higher stock prices.

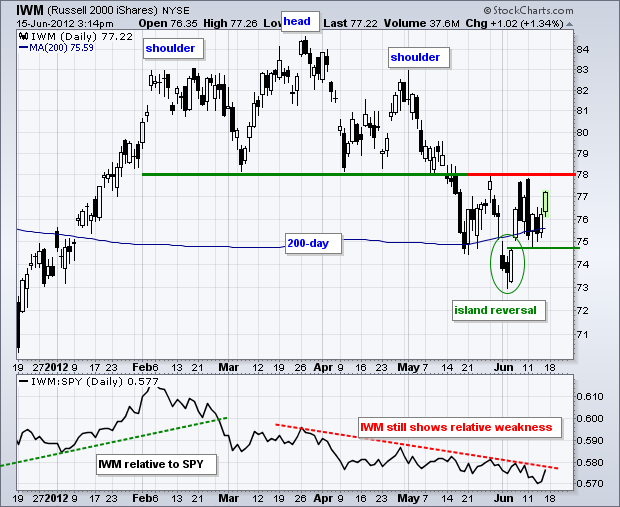
The Russell 2000 ETF (IWM) got a bounce at the end of the week, but remains in a trading range since the June 6th gap. There are two dynamics at work on this chart. First, the medium-term trend is down after the ETF broke neckline support from a head-and-shoulders pattern. Broken support turned into resistance, which held in late May and early June. A convincing break back above this level is needed to negate the head-and-shoulders breakdown.

Click this image for a live chart.
The second dynamic is the short-term uptrend. This is a counter-trend bounce with a bigger downtrend. IWM formed an island reversal in early June with a gap and move back above the 200-day SMA. This gap is holding as the ETF consolidates with a volatile trading range. Notice how IWM crossed the 76 level at least five times in the last eight days. The gap is still holding and this weekâs low marks support. A break below this low would signal a failed gap and a continuation of the medium-term downtrend. Of note, the indicator window shows the Price Relative (IWM:SPY ratio) hitting a new 2012 low this week. Small-caps are underperforming and this is a negative for the market overall.
Good trading!
Arthur Hill CMT
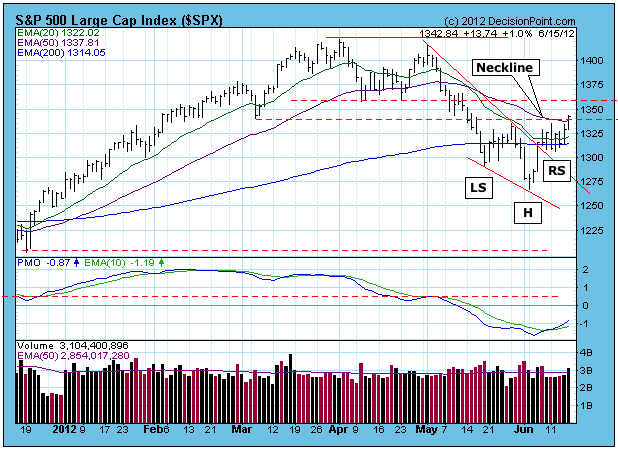
I have been expecting another short decline to finish out the right shoulders of a reverse head and shoulders pattern, but once again the Mr. Market said: "Expect whatever you like. I don't care."
My problem is that, being a person who likes things to be nice and neat, I wanted the right shoulder to be more even with the left shoulder. But no. What we have is a formation that is very lopsided, but I think it is close enough to be considered a completed reverse head and shoulders pattern. The neckline has been penetrated, so the minimum upside target is about 1430.

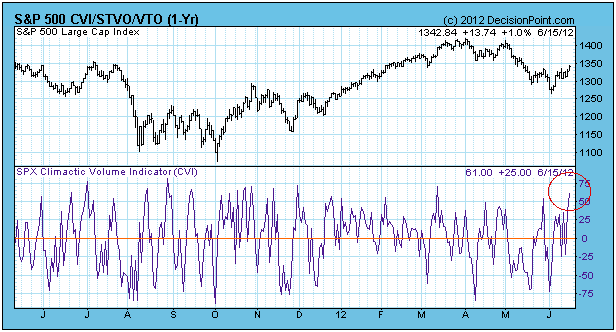
Unfortunately, the bullish breakout on the price chart is contradicted by the Climactic Volume Indicator (CVI) chart, which spiked to a level that usually signals a short-term top.

Conclusion: It is possible that Saturday's upcoming elections in Greece may have triggered some short-covering ahead of the weekend, resulting in a rally that may prove to have no legs. The breakout is far from decisive, and the CVI indicates a possible exhaustion climax, so I remain skeptical of the rally.