Hello Fellow ChartWatchers!
It's a question I get everywhere I go. After every talk I give, someone comes up and asks "What's the one market indicator I should watch to see where things are headed?" Many years ago that question gave me fits. In my brain I'd immediately have 1,000 thoughts: "There are so many indicators to choose from" and "Each indicator is interpreted differently" and "What if there are conflicting signals?" and "What if the NYSE changes its membership?" and... You get the picture. Needless to say, the answer that came out of my mouth back then wasn't pretty, or easy to understand.
Now the answer is simple: The NYSE Bullish Percent Index - period.
I've written extensively on Bullish Percent Indexes (BPIs) before. If you are not familiar with them, please click here to learn more. The NYSE BPI ($BPNYA) is the "granddaddy of them all" and is one of the broadest BPIs we publish. On numerous occasions in the past, it has been a leading indicator for the market and it always deserves periodic attention from serious ChartWatchers.
So what is it telling us now?

Click the chart for a live version.
Well... the picture is not promising for a continuation of the long-term uptrend that started in 2009. The chart shows that, just like it did during the previous uptrend that went from 2002 to 2007, the NYSE BPI is breaking down and diverging from the S&P 500 index. Recently the index tried and failed to rise back above the 70% level. That failure is significant because it continues a trend of lower peaks on the chart going back to the start of 2011 and creates a clear divergence with the S&P's uptrend.
A similar situation occured in mid-2005 when the index failed to stay above 70 (and then failed again twice in 2006) .
Now that the divergence with the S&P is clearly established, any significant weakness in the NYSE BPI should be taken as a warning sign. Conservative investors may watch for a move below 40. That would have gotten them out of the previous uptrend just after the start of 2007. Aggressive investors may watch for a move below 30 which, in the previous uptrend, would have gotten them out at the end of 2007.
If the market starts to move higher again, pretty soon you will start hearing hoopla about the S&P reaching 1500, the Dow closing in on 14,000, etc. Don't be fooled. Keep your eye on the NYSE Bullish Percent. If it continues to slump, the 2009 rally will not last much longer.
- Chip Anderson
P.S. I would love to meet you at one of our upcoming SCU Seminars. During the SCU 101 seminar, I go into much more detail about Bullish Percent Indexes, Sector Rotation, and how to use all of the various tools on our website. We have upcoming seminars in Dallas, Orlando, Seattle, LA and New York. Click here for details. I hope to see you soon!
Lumber prices surged Wednesday after the devastation on the east coast.
[I live in New Jersey which was hit especially hard]. There's a lot
of rebuilding that's going to be needed as a result And that's going
to require a lot of lumber. Lumber has in fact been rising over the
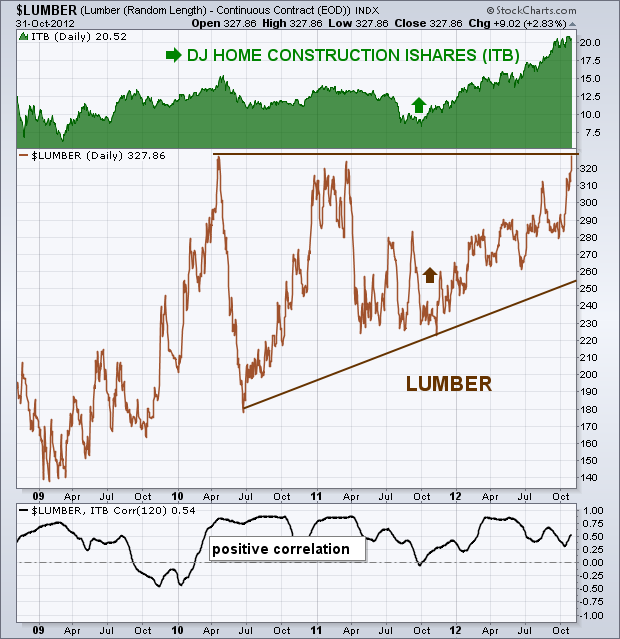
last year as the housing industry has recovered. The chart below shows a
positive correlation between the price of lumber and Dow Jones Home Construction iShares
(green area) over the last four years. The homebuilding index
bottomed last October and has since risen to the highest level in four
years. That also began a strong rally in the price of lumber (see
arrows). The chart also shows lumber on the verge of breaking out of a
large "ascending triangle" pattern. [An ascending pattern is
identified by a flat upper line and a rising lower line and is usually a
bullish pattern]. The improvement in housing and this week's east
coast damage should combine to make the price of lumber a lot more
expensive. One way to participate in that rally is to buy lumber
futures. Another way is to buy stocks tied to lumber.

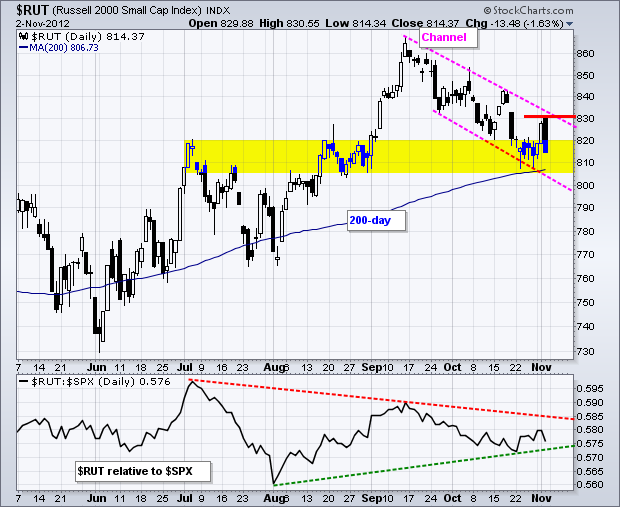
Stocks surged on Thursday and even followed through on Friday morning, but strength did not last long as selling pressure kicked in after the initial pop. Perhaps some pre-election jitters produced this classic pop and drop. Whatever the case, the Russell 2000 hit stiff resistance near its channel trend line and remains in a short-term downtrend. The chart below shows the index zigzagging lower since mid September. $RUT found support at the 200-day moving average and the late August consolidation (yellow area). Thursdayâs surge off support was impressive, but follow through is what separates one-hit wonders from trend reversals. A follow through breakout is needed to reverse this seven-week slide and signal a continuation of the bigger uptrend, which has been in place since early June.

Click this image for a live chart.
The indicator window shows the $RUT:$SPX ratio triangulating the last four months. A potential higher low could be forming in October, but we need to see a breakout to signal relative strength in the Russell 2000 (small-caps). This would be positive for the overall market. Note, however, that a break below the October low would signal renewed relative weakness in small-caps.
Good trading and good weekend!
Arthur Hill CMT
One month ago, I discussed the increased risk of holding gold as key price resistance was being tested with a long-term negative divergence on the MACD present. That was a sign of slowing momentum and that, combined with price resistance, simply tells us to grab profits and respect the resistance - at least until gold makes the breakout. Well, the breakout was never made. In fact, take a look at the following two charts.
The first chart is how gold looked one month ago:

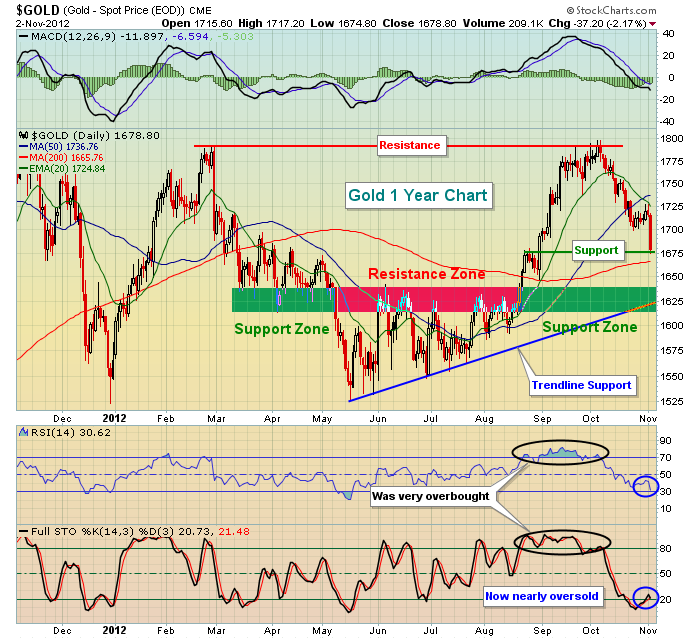
Now let's fast forward to show that resistance did, in fact, hold back the bulls and the slowing momentum and overbought conditions resulted in an approximate 7% drop that has now sent gold back much closer to key price and trendline support levels:

After flirting with $1800 per ounce, gold has fallen back to Friday's $1679 level. Note on the chart above that initial support resides at $1675. If that level doesn't hold - and it may not - more significant price support and a key trendline both coincide in the $1615-$1640 per ounce range. I'd expect that basic risk management would certainly begin to favor the bulls once again at those prices.
You can buy the metal or an ETF like the SPDR Gold Trust Shares (GLD) to attempt to profit from swings in the price of gold. Another way to potentially benefit is to buy the stock of a gold miner. One gold miner looks interesting to me and I'm including it as my Chart of the Day for Monday, November 5th, 2012. It's provided FREE and you can learn more by
CLICKING HERE Happy trading!
Thomas J. Bowley
Chief Market Strategist
Invested Central