One of the most consistent intermarket principles is that gold (and most
commodities) usually trend in the opposite direction of the U.S.
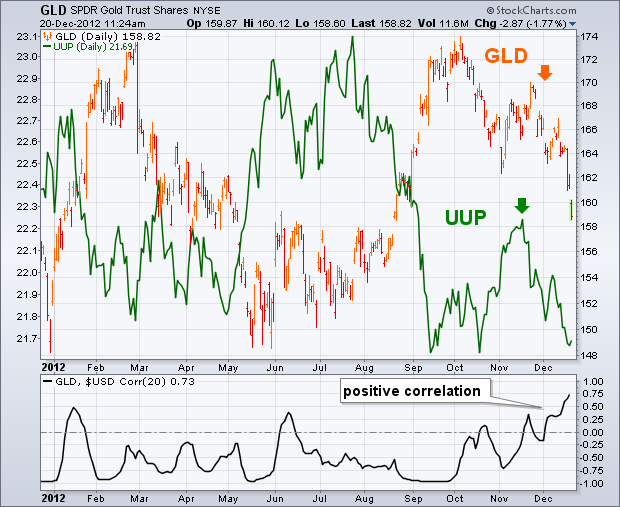
Dollar. That inverse relationship has broken down of late. Chart 1
compares the Gold Trust (GLD) to the Dollar Index (UUP)
over the last year. Both markets have trended in opposite direction
throughout most of the year -- until recently. The dollar bottom
during October coincided with a peak in gold which is normal. What
isn't normal is that both market have fallen together over the last
month. The 20-day Correlation Coefficient (below chart) shows their
correlation turning positive. When something unusual happens in
intermarket work, there's usually a reason why. Let's examine the UUP a
bit closer for some clues. Although the Dollar Index (UUP) measures
the dollar against six currencies, it's dominated by the Euro. The
Euro is the biggest foreign currency in the UUP with a weighting of 57%
(Europe's four currencies comprise nearly three-quarters of the UUP).
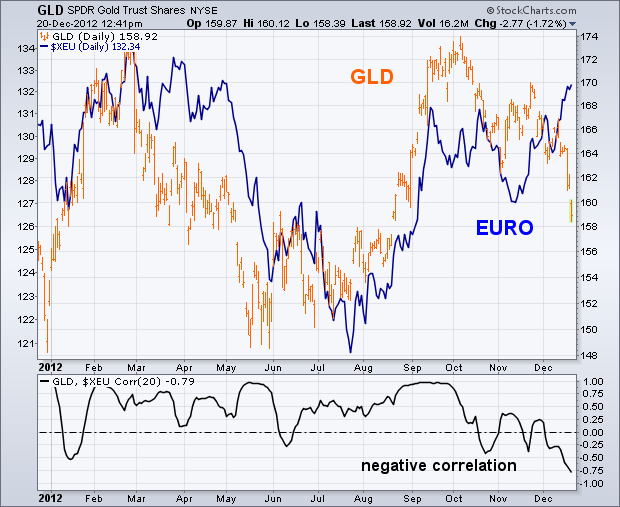
Chart 2 shows that the Euro and gold
usually trend in the same direction. That was the case until
mid-November when a rising Euro coincided with falling gold. The
20-day Coefficient (below chart) turned has turned negative which is
unusual. So the answer to the recent change in the gold/currency
relationship doesn't come from the Euro. It may be coming from the
yen.
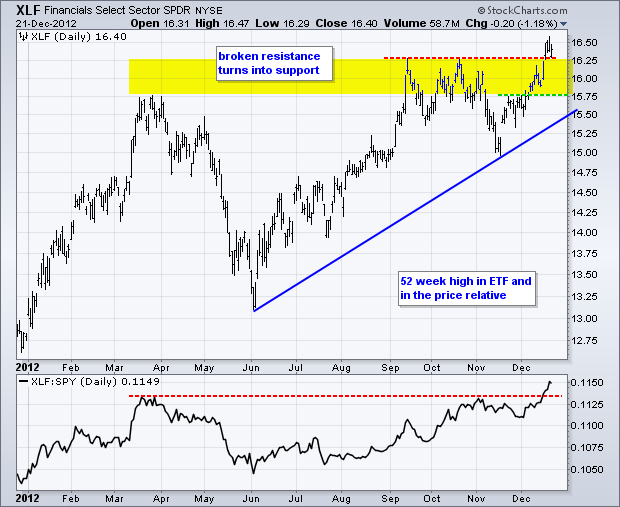
2012 is ending with a bang for banking stocks as sentiment towards this sector improved significantly in December. Perhaps the big banks are looking forward to open-ended quantitative easing in 2013. The chart below shows the Finance SPDR (XLF) breaking above its autumn highs to record a 52-week high. In addition, the price relative (XLF:SPY ratio) recorded a 52-week high as XLF led the market higher. On the price chart, broken resistance in the 15.75-16.25 area turns into the first support zone to watch on any throwback (pullback). XLF is a bit overbought after a 10% advance since mid November, which makes it ripe for a pullback or consolidation. However, any weakness would be deemed a correction within a bigger uptrend.
Click this image for a live chart
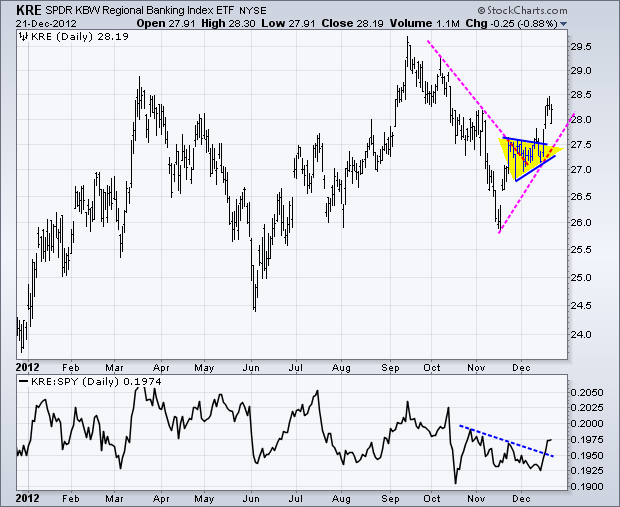
Regional banks are not as strong as the big banks, but the Regional Bank SPDR (KRE) came to life with a triangle breakout. KRE surged in mid November, consolidated with a small triangle (pennant) and broke resistance with a big move. This is a bullish development and the triangle now marks a support zone. The indicator window shows the price relative (KRE:SPY ratio) surging above the late October trend line.
Merry Christmas and Happy New Year!!â¨
--Arthur Hill CMT
About
a month ago I wrote an article stating that I thought that gold was
resuming its long-term up trend, but that belief was conditioned upon
price moving above the October top. That did not happen. Instead, after
putting in a lower top in November, price has dropped below the November
low, establishing a three-month down trend.
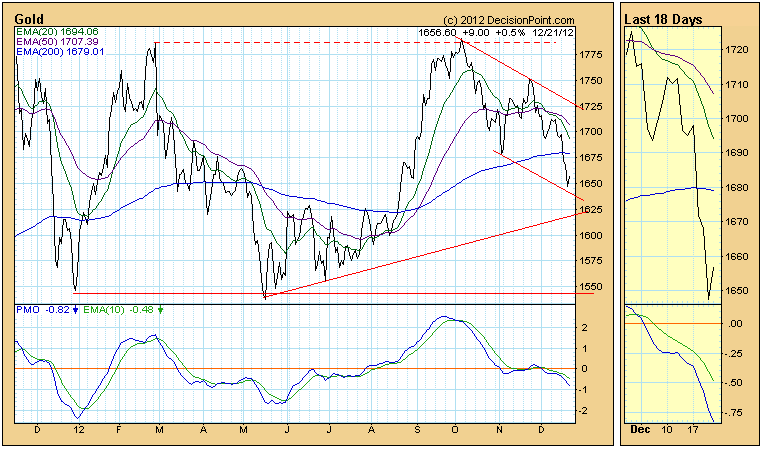
The
weekly chart shows that price has dropped below a long-term rising
trend line, but I think the trading range (consolidation) between 1540
and 1800 is the dominant feature on the chart. It has held for over a
year, and is considered to be a continuation pattern. The technical
expectation is that price will head higher once the consolidation is
complete. If the bottom of that range is violated, then gold would be in
serious technical trouble.
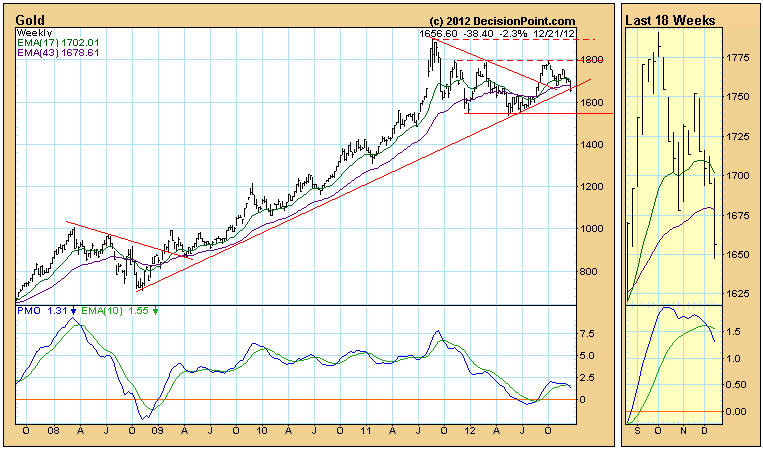
Because
of the down trend since October, technical weakness is expressed
through the PMOs (Price Momentum Oscillators) in the daily, weekly, and
monthly (not shown) time frames, which are below their EMAs and falling.
The Trend Model is NEUTRAL, which is appropriate for a trading range.
To historians, this doesn't come as a surprise. Since 1987, the Russell 2000 has produced annualized returns during the month of December of 43.38%. April is the next best month for small caps with its annualized return of 21.84%, a very distant second. Over the past 25 years, the Russell 2000 has fallen during December only 3 times. In 2007, they fell 0.23%. In 2005, they fell 0.60%. The only poor December that small caps have experienced came in 2002 when they tumbled 5.72%. Certainly part of that decline resulted from the 8.80% climb a month earlier in November 2002. The point here is that history does tend to repeat itself in the stock market and December 2012 appears to be no different for small cap traders.
Consider the month-to-date gains thus far by index:
Dow Jones: +1.27%
S&P 500: +0.99%
NASDAQ: +0.36%
Russell 2000: +3.16%
I'll admit that my background as a CPA qualifies me as a "numbers geek". So let's take a look at the December small cap relative outperformance another way - visually:
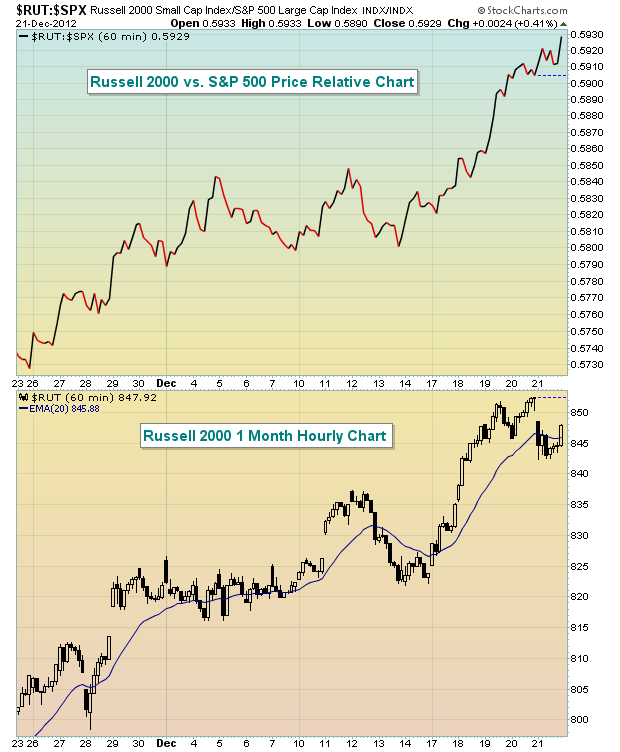
This chart shows us the strength (and the relative strength) of the Russell 2000 over the past month. But there's likely to be more relative strength in the days ahead. From December 21st through December 31st, the Russell 2000 has racked up annualized returns of 96.19% since 1987. The percentage of up days during this period is 69.36%, well ahead of the 55.40% chance of an up day throughout the year.
There's really no Santa Claus rally like the one we see on the Russell 2000 each year.
Happy Holidays and happy trading!
In the past several weeks, the FOMC has voted to "expand" its balance sheet until which time economic growth is strong and getting stronger ($45 billion long-term treasuries/$45 MBS). One would have reasonably thought that Gold prices ($GOLD) would have rallied rather sharply - we certainly were of the opinion. But it did not happen given the gamesmanship exhibited by President Obama and House Speaker Boehner. However, the "game" is not over; there is still time for gold to find its footing and finally move to higher highs above $2000/ox upon which the media shall be all over this.
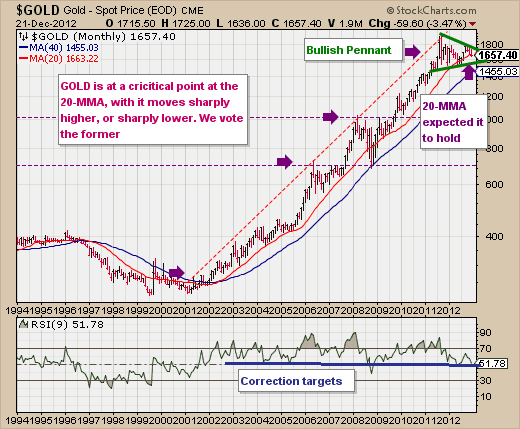
Technically speaking, if we take a longer-term viewpoint of Gold ($GOLD), then we find the uptrend still intact, although probably a bit long in the tooth. However, that doesn't sway from the fact that a monthly bullish triangle is forming, and the fact prices managed to hold the 20-month moving average last week. Historically, the 20-month has been a very good support level - outside of the late-2008 correction that managed top hold the 40-month moving average. Too, we find the 9-month RSI tends to bottom around the 50-level on these corrections - which is exactly where it is at present. Therefore, we suspect the probabilities favor that this current test of the 20-,month will be succesful - hence a modicum of patience is warranted in holding a long position.
But that having been said, the alternative would be for prices to clear break the 20-month and fall very quickly towards the 20-month support level at $1455/oz. That is and of itself would be no tragedy to the gold bull market, but it it would certainly deplete many trading accounts to be sure. Regardless, we believe gold prices ($GOLD) have one last "blow off" move in them before a larger correction takes place. Its only natural, for gold is cyclical as well.