Latest News
ChartWatchers7h ago

Tech Stocks Lead the Charge: What's Driving the Momentum?
The last day of trading for the first half of 2025 ended with a bang. The S&P 500 ($SPX) and Nasdaq Composite ($COMPQ) closed at record highs — an impressive finish, given the year has seen significant swings Read More
Trading Places with Tom Bowley1d ago

Is This Rally Sustainable? You Better Bet Your Bullish Sweet Dollar It Is!
Below is the EB Weekly Market Report that I sent out earlier to our EarningsBeats.com members. This will give you an idea of the depth of our weekly report, which is a very small piece of our regular service offerings Read More
The MEM Edge1d ago

Pullbacks & Reversals: Stocks Setting Up for Big Moves!
In this video, Mary Ellen spotlights key pullback opportunities and reversal setups in the wake of a strong market week, one which saw all-time highs in the S&P 500 and Nasdaq Read More
RRG Charts1d ago

The Best Five Sectors, #25
A Greek Odyssey First of all, I apologize for any potential delays or inconsistencies this week. I'm currently writing this from a hotel room in Greece, surrounded by what I can only describe as the usual Greek chaos Read More
Analyzing India3d ago

Week Ahead: As NIFTY Breaks Out, Change of Leadership Likely to Keep the Index Moving
After six weeks of consolidation and trading in a defined range, the markets finally broke out from this formation and ended the week with gains. Over the past five sessions, the markets have largely traded with a positive undercurrent, continuing to edge higher Read More
A View From the Floor3d ago

3 Stock Setups for the Second Half of 2025
As we head into the second half of 2025, here are three stocks that present strong technical setups with favorable risk/reward profiles. One is the largest market cap stock we're familiar with, which bodes well for the market in general Read More
The Mindful Investor3d ago
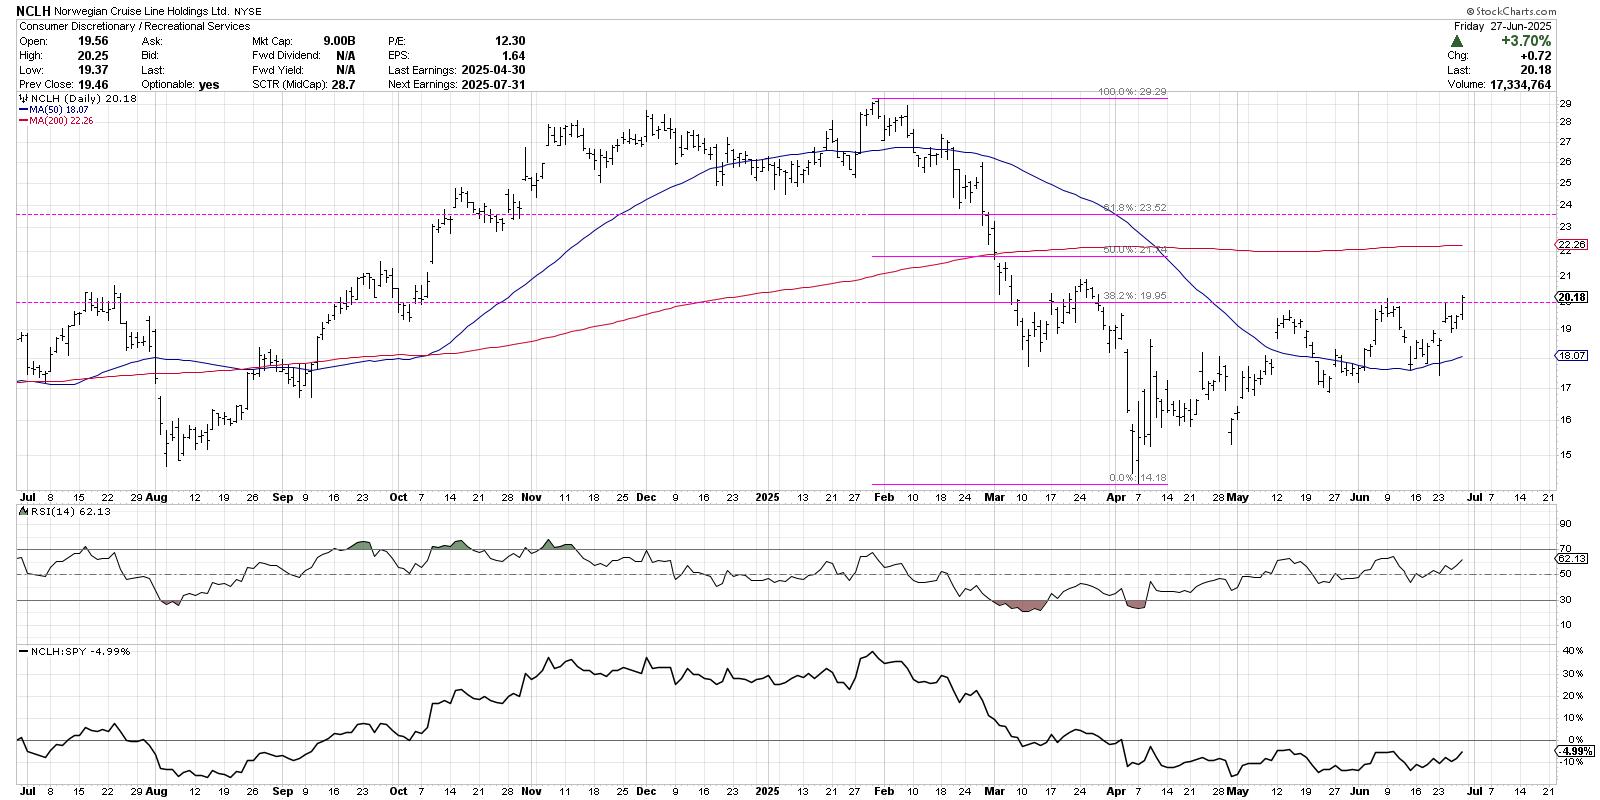
Fibonacci Retracements: The Key to Identifying True Breakouts
If you've looked at enough charts over time, you start to recognize classic patterns that often appear. From head-and-shoulders tops to cup-and-handle patterns, they almost jump off the page when you bring up the chart Read More
Trading Places with Tom Bowley4d ago
All-Time Highs and An Upcoming Rate Cut: We're Just Getting Started on This Move Higher
The bears are now left grasping at straws. What about tariffs? What about inflation? What about recession? What about the Fed? What about interest rates? What about the Middle East? What about the deficits? Blah, blah, blah Read More
Art's Charts4d ago
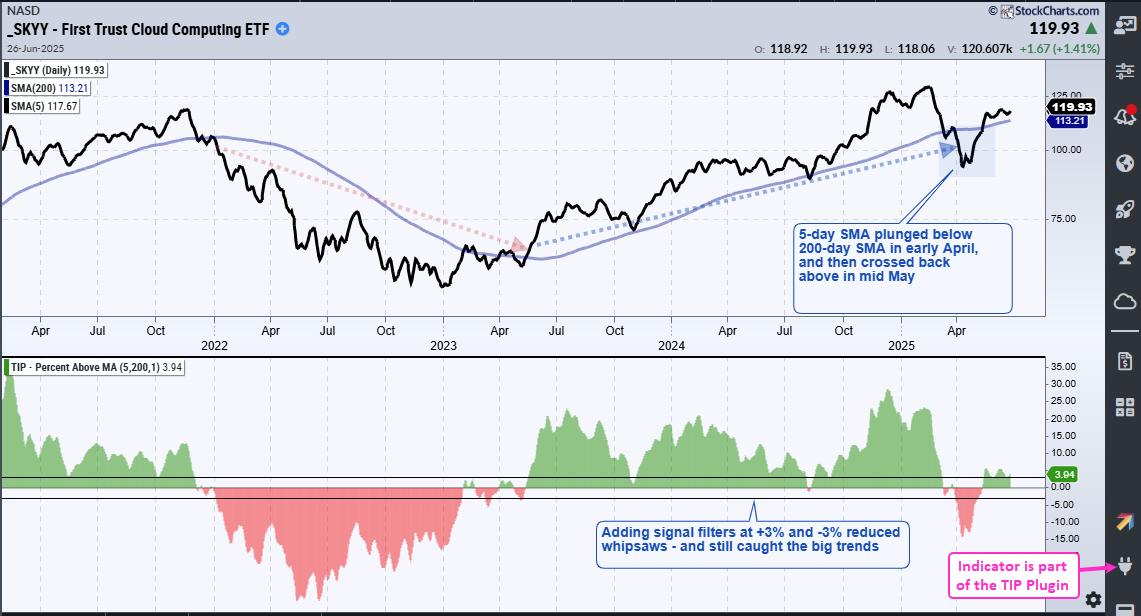
How to Improve your Trading Odds and Increase Opportunities
Chartists can improve their odds and increase the number of opportunities by trading short-term bullish setups within bigger uptrends. The first order of business is to identify the long-term trend using a trend-following indicator Read More
StockCharts In Focus4d ago

NEW! 5 Significant Additions to Our Professionally-Curated Market Summary Dashboard
Take a tour of the FIVE latest updates and additions to our fan-favorite, professionally-curated Market Summary dashboard with Grayson! In this video, Grayson walks viewers through the new charts and indexes that have been added to multiple panels on the page Read More
Don't Ignore This Chart!4d ago

SMCI Stock Surges: How to Invest Wisely Now
Over a month ago, Super Micro Computer, Inc. (SMCI) appeared on our StockCharts Technical Rank (SCTR) Top 10 list. SCTRs are an exclusive StockCharts tool that can help you quickly find stocks showing strong technical strength relative to other stocks in a similar category Read More
Stock Talk with Joe Rabil5d ago

From Drift to Lift: Spotting Breakouts Before Momentum Hits
MACD, ADX and S&P 500 action frame Joe Rabil's latest show, where a drifting index push him toward single-stock breakouts Read More
CappThesis5d ago

Breakdown of NVDA's Stock Price and S&P 500: Actionable Technical Insights
The S&P 500 ($SPX) just logged its second consecutive 1% gain on Tuesday. That's three solid 1% advances so far in June. And with a few trading days remaining in the month, the index has recorded only one 1% decline so far Read More
ChartWatchers5d ago

Find Highest Probability Counter-Trend Setups
Think trading against the trend is risky? You may want to reconsider. When a stock or ETF is trending lower, the smart money watches for signs of a reversal; those early signals can get you into a trend before everyone else and lead to favorable risk-to-reward ratios Read More
Add-on Subscribers
OptionsPlay with Tony Zhang5d ago
Find Highest Probability Counter-Trend Setups
Think trading against the trend is risky? You may want to reconsider. When a stock or ETF is trending lower, the smart money watches for signs of a reversal; those early signals can get you into a trend before everyone else and lead to favorable risk-to-reward ratios Read More
ChartWatchers6d ago

Shifting Tides in the Stock Market: A New Era for Bulls?
The stock market has been on quite the rollercoaster of late, thanks to news headlines. But investors seem to have shrugged off the past weekend's geopolitical tensions, at least for now. On Tuesday, we saw a surge of enthusiasm Read More
The Mindful Investor6d ago
How to Use Fibonacci Retracements to Spot Key Levels
Join Dave as he shares how he uses the power of Fibonacci retracements to anticipate potential turning points Read More
Members Only
Martin Pring's Market Roundup6d ago
Never Easy to Predict, the Price of Crude Just Got Harder
Earlier in the month, I wrote an article pointing out that gold and copper typically move ahead of oil. It's true, the leads and lags between these three entities differ from cycle to cycle Read More
ChartWatchers6d ago

Offense vs. Defense: How Geopolitical Tensions Shape Market Trends
As the cycle of uncertainty continues to yield confusion than clarity, investors are again caught having to decide between taking an offensive and defensive posture in the market. The tough part in today's market environment is how fast situations can shift Read More
The MEM Edge1w ago

AI Stocks Ignite Again—Where Smart Money is Heading Next
In this video, Mary Ellen opens with a look at the S&P 500, noting that the index remains above its 10-day average despite a brief pullback—a sign of healthy market breadth Read More
A View From the Floor1w ago

This Week's Earnings Watch: Turnarounds and Momentum Plays
This week, we're keeping an eye on three major stocks that are reporting earnings. Two of them have been beaten down and are looking to turn things around, while the third has had a tremendous run and is looking to keep its extraordinary momentum going Read More
RRG Charts1w ago
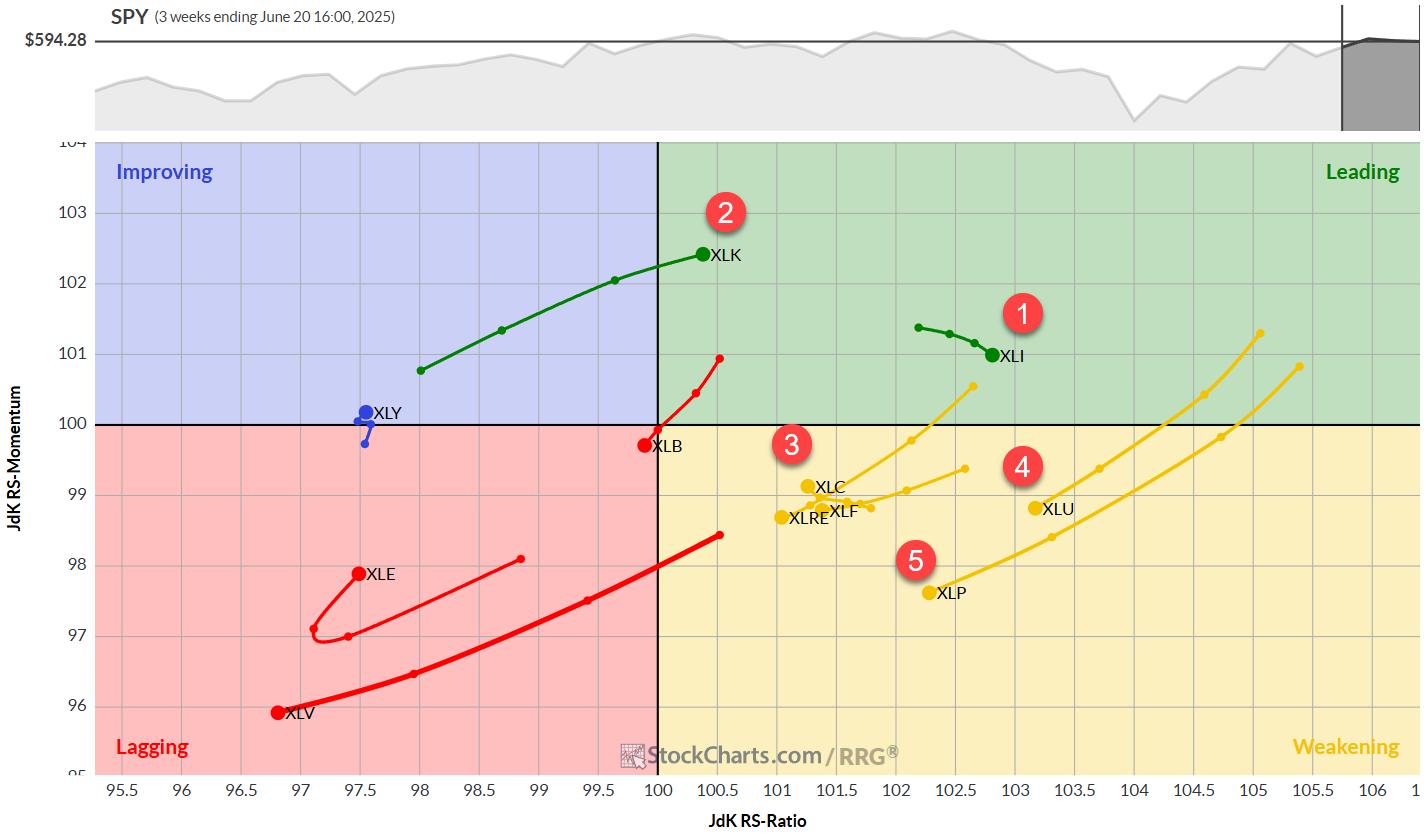
The Best Five Sectors, #24
Some Sector Reshuffling, But No New Entries/Exits Despite a backdrop of significant geopolitical events over the weekend, the market's reaction appears muted -- at least, in European trading Read More
Art's Charts1w ago

Lagging Mid-cap ETF Hits Moment of Truth
The S&P MidCap 400 SPDR (MDY) is trading at a moment of truth as its 5-day SMA returns to the 200-day SMA. A bearish trend signal triggered in early March. Despite a strong bounce from early April to mid May, this signal remains in force because it has yet to be proven otherwise Read More
Trading Places with Tom Bowley1w ago

US Strikes Iran: What Comes Next For Stocks?
In today's "Weekly Market Recap", EarningsBeats.com's Chief Market Strategist Tom Bowley looks ahead to determine the likely path for U.S. equities after the weekend bombing of Iran nuclear sites Read More
Trading Places with Tom Bowley1w ago
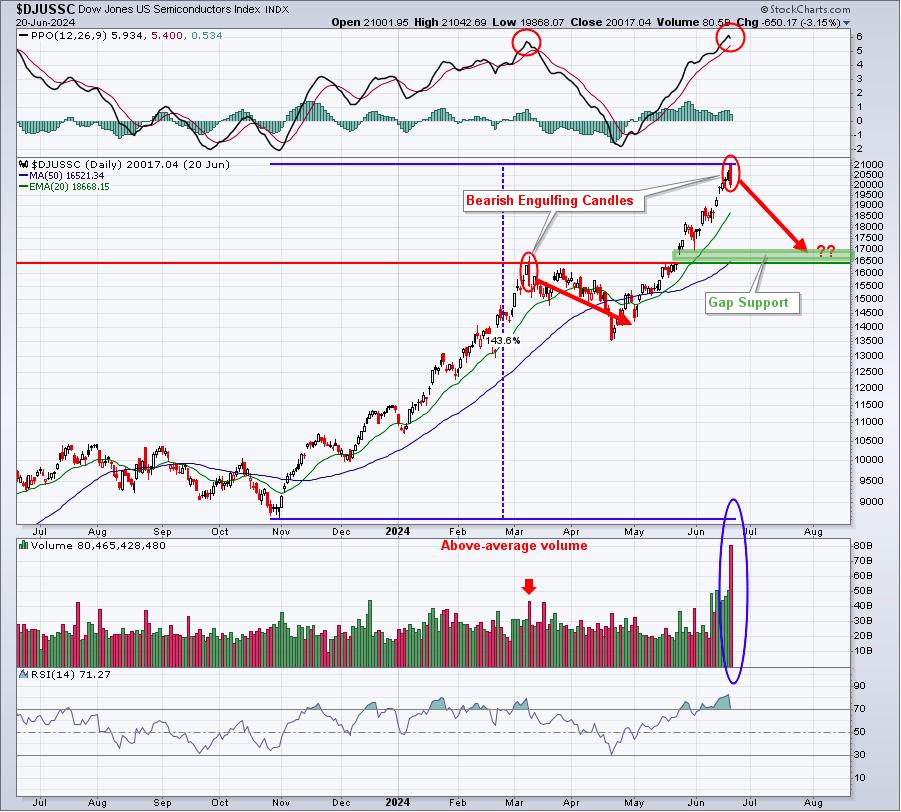
The NASDAQ 100, On The Brink Of A Breakout, Needs Help From This Group
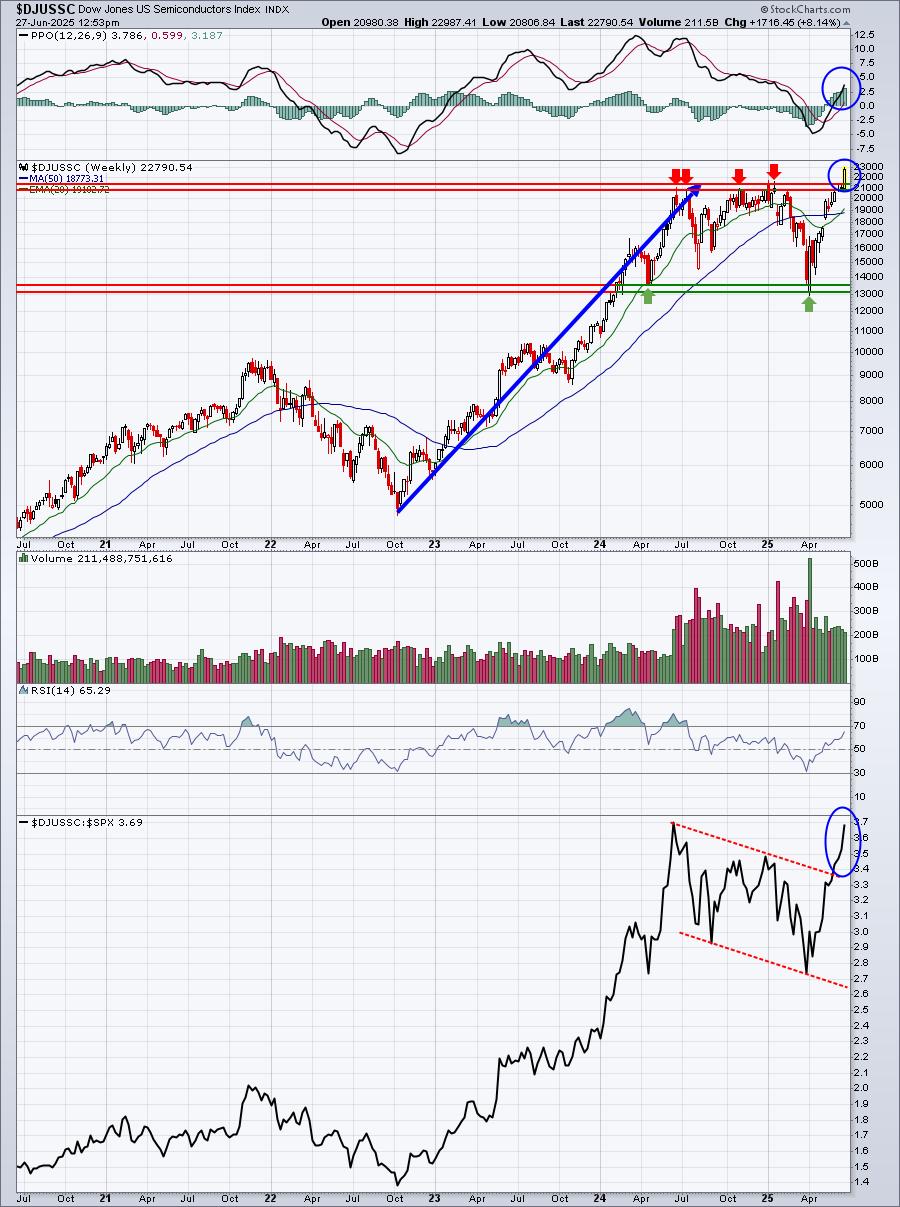
U.S. stocks are on the cusp of a very impressive breakout to all-time highs, but are still missing one key ingredient. They need help in the form of a semiconductors ($DJUSSC) breakout of its own Read More
RRG Charts1w ago

RRG Alert Tech Vaults to ‘Leading'—Is XLK Signaling a New Rally?
This week, Julius breaks down the current sector rotation using his signature Relative Rotation Graphs, with XLK vaulting into the leading quadrant while utilities and staples fade Read More
Trading Places with Tom Bowley1w ago
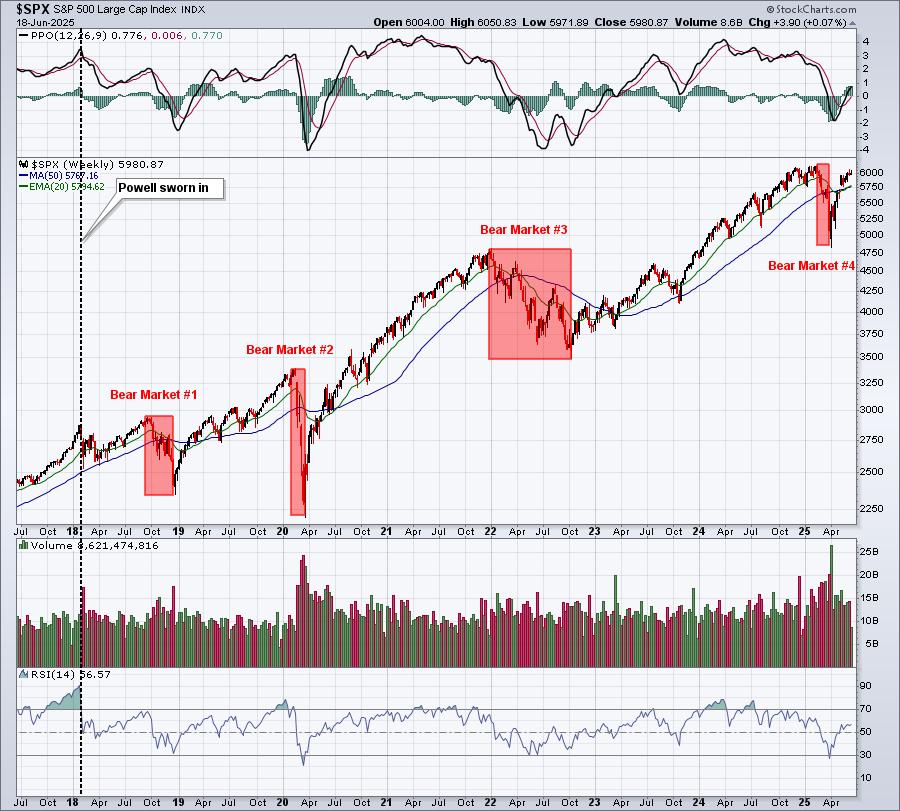
The Fed Is Getting It Wrong AGAIN As They Hold Rates Steady
The Fed should absolutely stop talking about being "data dependent". That's so far from the truth. If they were data dependent, we'd have either seen a rate cut today or Fed Chief Powell would have been discussing one for the next meeting Read More
ChartWatchers1w ago

Feeling Unsure About the Stock Market's Next Move? These Charts Can Help
When the stock market seems to be drifting sideways without displaying a clear bullish or bearish bias, it's normal for investors to get anxious. It's like being at a crossroads, wondering whether to go left, right, or stay put Read More
StockCharts In Focus1w ago

The Secret To Streamlining Your Charting Workflow
Grayson explores a hidden gem on the SharpCharts platform: StyleButtons! These handy little customizable tabs give you quick, one-click access to your favorite chart templates, allowing you to jump from ChartStyle to ChartStyle with a seriously streamlined charting workflow Read More
Stock Talk with Joe Rabil1w ago

Joe Rabil's Undercut & Rally Pattern: From DROP to POP
Joe presents his game-changing "undercut and rally" trading pattern, which can be found in high volatility conditions and observed via RSI, MACD and ADX signals Read More
CappThesis1w ago

3 S&P 500 Charts That Point to the Next Big Move
Follow along with Frank as he presents the outlook for the S&P 500, using three key charts to spot bullish breakouts, pullback zones, and MACD signals Read More
Members Only
Martin Pring's Market Roundup2w ago
G7 Meeting in Canada Could Be Opportune Time for Accumulating Canadian Dollar and Canadian Equities
The Canadian dollar peaked in 2007 and 2011 at around $1.05, and it has been zig-zagging downwards ever since. Now at a lowly 73 cents USD, the currency looks as if it may be in the process of bottoming, or at the very least entering a multi-year trading range Read More
ChartWatchers2w ago

Navigate the Stock Market with Confidence
When you see headlines about geopolitical tensions and how the stock market sold off on the news, it can feel unsettling, especially when it comes to your hard-earned savings. But what you might not hear about in the news is what the charts are indicating Read More
A View From the Floor2w ago

Diving into Energy Investments: Uncover Hidden Gems Today!
With oil prices surging and geopolitical unrest stirring in the Middle East, it's no surprise that energy stocks are drawing renewed attention. And, quite frankly, this week didn't have many market-moving earnings Read More
The MEM Edge2w ago

Major Shift in the Markets! Here's Where the New Strength Is
In this video, Mary Ellen spotlights breakouts in Energy and Defense, Technology sector leadership, S&P 500 resilience, and more. She then unpacks the stablecoin fallout hitting Visa and Mastercard, highlights Oracle's earnings breakout, and shares some pullback opportunities Read More
RRG Charts2w ago
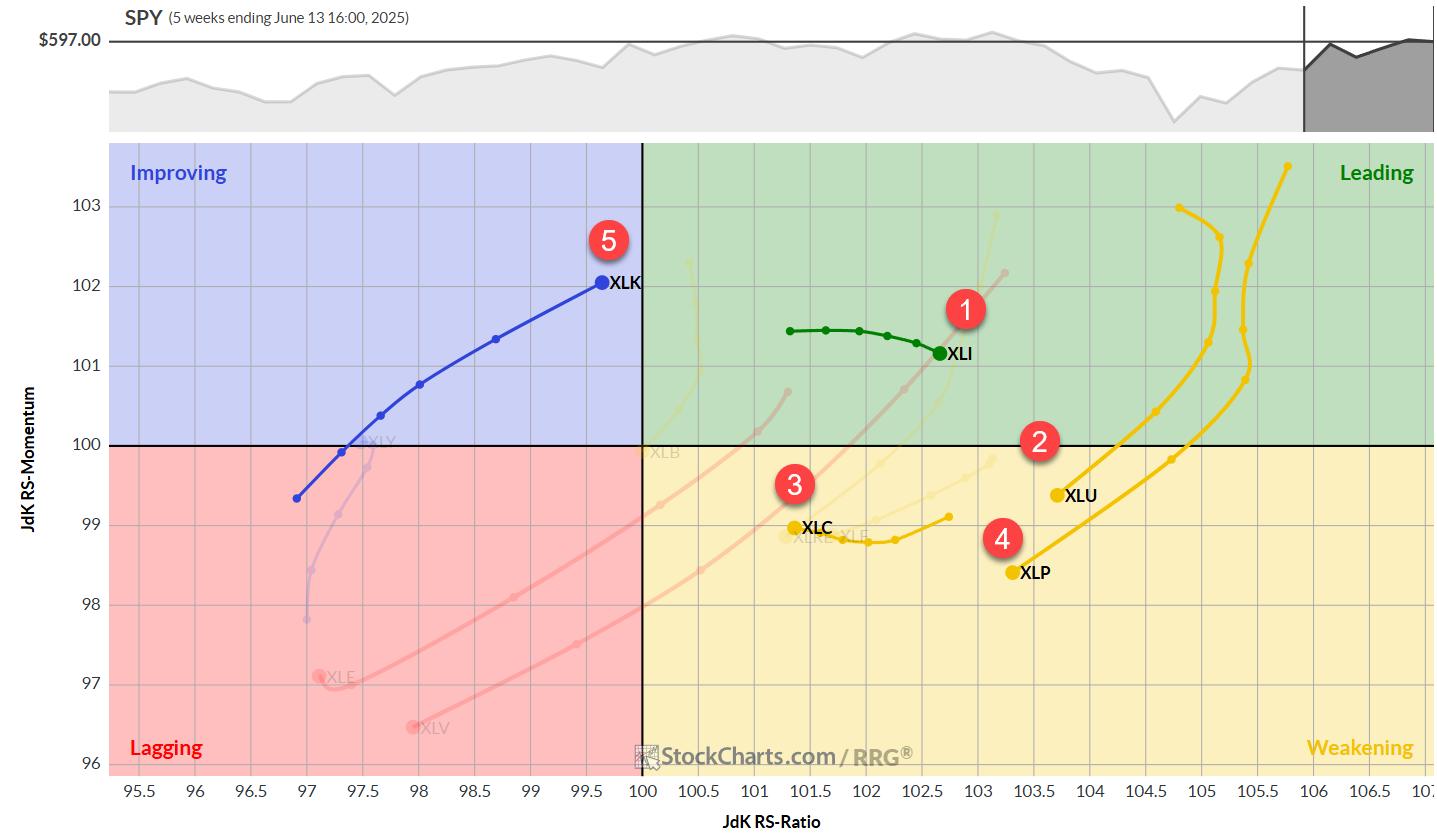
The Best Five Sectors, #23
This Time Technology Beats Financials After a week of no changes, we're back with renewed sector movements, and it's another round of leapfrogging Read More
Analyzing India2w ago

Week Ahead: NIFTY May Continue Showing Resilience; Broader Markets May Relatively Outperform
An attempt to break out of a month-long consolidation fizzled out as the Nifty declined and returned inside the trading zone it had created for itself Read More
The Mindful Investor2w ago

Bearish Divergence Suggests Caution For S&P 500
With Friday's pullback after a relatively strong week, the S&P 500 chart appears to be flashing a rare but powerful signal that is quite common at major market tops Read More
Don't Ignore This Chart!2w ago

Is a Bold Rotation Brewing in Healthcare and Biotech? Here's What to Watch Now
Catching a sector early as it rotates out of a slump is one of the more reliable ways to get ahead of an emerging trend. You just have to make sure the rotation has enough strength to follow through Read More
Art's Charts2w ago
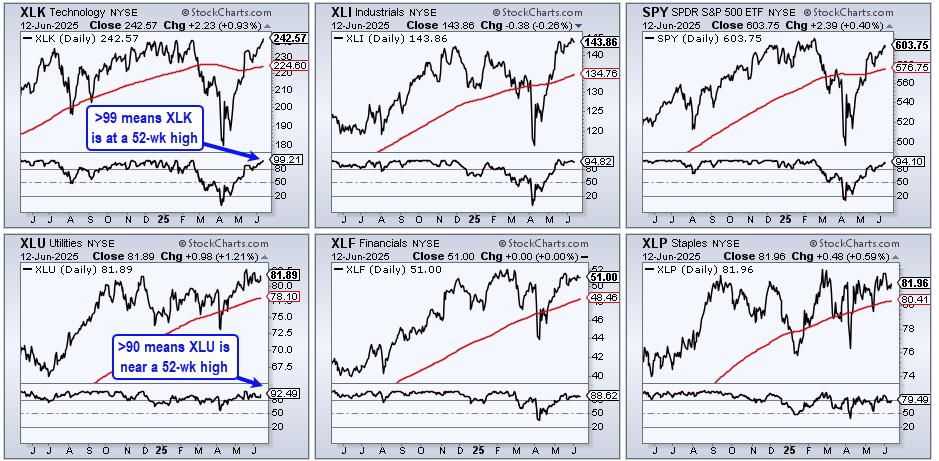
Three Sectors Stand Out and One Sports a Bullish Breakout
Three sectors stand out, with one sporting a recent breakout that argues for higher prices. Today's report will highlight three criteria to define a leading uptrend. First, price should be above the rising 200-day SMA Read More


