Charts: KFT, LLY, URBN XRAY
Stocks are up sharply in early trading ahead of today's FOMC policy statement. Even though the major stock indices are still looking overbought, the current uptrend remains in place as stocks continue to attract money. It takes some real guts to buy overbought stocks ahead of a Fed statement. Be careful out there. A run through the charts reveals two triangle breakouts, a lagging retailer and a promising pharmaceutical.
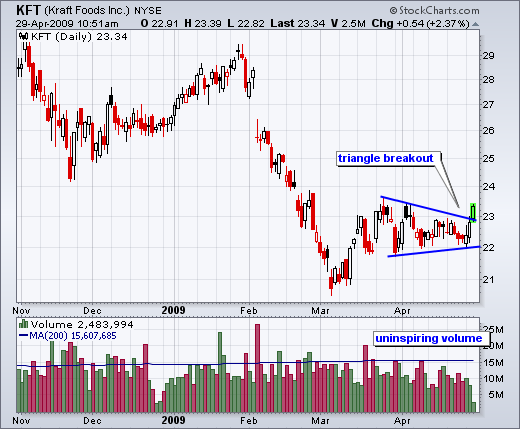
Kraft (KFT) broke triangle resistance with a surge above 23 today. The stock fell sharply from late February to early March. In fact, a 27% decline in six weeks seems extreme for a defensive consumer staple stock. Perhaps Kraft foods are not organic/green enough. Kraft rebounded later in March and then formed a triangle consolidation for six weeks. The stock went on to break triangle resistance with a nice surge over the last two days, but volume has not been impressive and this could come back to haunt the bulls.
Dentsply (XRAY), which is part of the healthcare sector, broke triangle resistance with a surge over the last five days. It all started with a bullish engulfing on high volume five days ago. Follow through above 27 confirmed the bullish engulfing and today's triangle breakout is further bullish. Failure to hold this breakout and a move back below 26.5 would call for a reassessment.
Urban Outfitters (URBN) bounced off trendline support over the last two days. The stock surged in March with a big move above the February high. Even though the subsequent pullback was rather sharp, a falling wedge formed and the stock held above its March low. The wedge breakout in early April looks like the start of another leg higher. It is also worth noting that URBN is lagging other retailers because it remains below its March high. In contrast, Aeropostale (ARO) and Abercrombie (ANF) both broke above their March highs this month.
Eli Lilly (LLY) shows good upside volume as it bounces off support. Lilly is part of the healthcare sector, which has been lagging the broader market. The stock surged in March and then consolidated with a lopsided triangle over the last 5-6 weeks. Despite a decline on high volume last week, the stock held support around 32 and edged higher the last four days. Volume was above average three of the last four days and this pushed OBV higher. With upside volume improving, the prospects of a triangle breakout are increasing.


