Charts Worth Watching: ANF, AZO, CAL, CB, INTC, ITB,
LUV, PGR, QQQQ, SMH, SWY, SYY, XLB, XLF
The next update will be Friday (May 22) around 9AM ET.
*****************************************************************
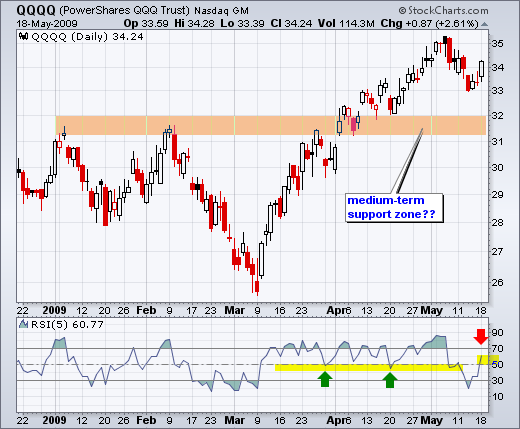
The moment of truth is close. Based on positive reports from State Street (STT) and Lowe's (LOW), stocks moved sharply higher on Monday. This advance follows the sharpest decline since early March - I do mean early (2-5 March). Is this a resumption of the March-May advance or just a dead-cat bounce? Last week's decline featured strong downside breadth and above average volume. In addition, techs and small-caps started showing relative weakness in May. Combined with medium-term overbought conditions, these signs point to a correction in the coming weeks. Even with a corrective period, there will be short-term oversold bounces along the way. After last week's sharp declines, many ETFs and stocks were short-term oversold. On the QQQQ chart, notice that 5-period RSI moved below 30. With today's bounce, 5-period RSI is back above 50. During the strong uptrend (March to May), the 40-50 zone acted as support on pullbacks (green arrows). Also notice that the 40-50 zone did not hold last week as RSI moved below 30. If a new downtrend has begun, I would expect the 50-60 zone to now act as resistance.

*****************************************************************
This next chart focuses on the short-term situation for QQQQ. The decline from 35.25 to 33 was the sharpest 5-day plunge since 9-March. This alone tells us that the bearish forces are gaining traction. On the chart, this decline looks like a falling flag, which is actually a bullish consolidation. Furthermore, QQQQ broke flag resistance with today's surge. While this breakout is technically bullish, the bovines could soon be facing their moment of truth. The bounce over the last 2-3 days retraced 50-62% of this decline. A dead-cat bounce would be expected to fizzle near this retracement and we should watch this zone closely. There are other ETFs with similar flag patterns on their 60-minute charts.


*****************************************************************
The Semiconductors HOLDRS (SMH) and Intel (INTC) warrant a close watch as both formed small consolidations after last week's sharp decline. SMH met resistance at the falling 200-day moving average in May and broke below channel support with a sharp decline. The stock then stalled over the last few days with a small wedge taking shape. A move below 19 would signal a continuation lower and this could weigh on techs. Conversely, a move back above the 200-day would show resilience that could lift the Nasdaq. Intel is important to watch because this is the biggest component of SMH. INTC also failed at its 200-day moving average and formed a small rising flag/wedge over the last few days. As with SMH, a break back above the 200-day would be bullish, while a break below support would be bearish.


*****************************************************************
Even though the overall market was up sharply on Monday, Abercrombie & Fitch (ANF) was down slightly with above average volume for the second day running. I featured this chart and will show it once again. The stock is trading near resistance from the April highs and MACD formed a negative divergence. MACD also moved below its signal line last week. The pink like shows the Accumulation Distribution Line moving sharply lower in May. This reflects an increase in selling pressure that could weigh on the stock in the coming days or weeks. A break above 27.5 would call for a reassessment.

Autozone (AZO), which is also part of the consumer discretionary sector, is testing support with a potentially bearish flag. The stock declined to support with high volume in April and again in May. The latest decline created an oversold condition that is being worked off with the rising flag. Notice that rising flag volume is below average. This pattern could signal a rest before a continuation lower. A move below 155 would likely lead to a definitive support break.

*****************************************************************
The next two stocks come from the consumer staples sector. Both feature falling flag/wedge patterns, but they are different sizes. Safeway (SWY) surged in mid March and then formed a falling flag over the last two months. SWY surged above 21 at the end of April, but this breakout did not hold. Perhaps the second time around will work better. SWY is up three of the last four days with above average volume. There is a lot of support around 19 and a break above flag resistance would be bullish.

Sysco (SYY) has a smaller flag/wedge working over the last 2-3 weeks. The stock surged to resistance around 25 and pulled back below 23. SYY bounced on Monday with pretty good volume that may signal support around 22.5. A flag/wedge break would be short-term bullish and set up a bigger resistance challenge around 25. Notice that a large inverse head-and-shoulders may be taking shape in 2009.

*****************************************************************
Chubb (CB) is trying to firm around 40, but remains short of a breakout. The stock broke flag/wedge resistance at 40, but fell back with broad market weakness last week. With today's market jump, CB closed back above 40 on above average volume. Follow through holds the key here. Look for a high-volume move above last week's high to provide a breakout.

Although in different segments, Progressive (PGR) is also part of the insurance group and the finance sector. PGR surged to resistance with a powerful move in March-April. The stock remained close to resistance as it consolidated the last few weeks. Notice that upside volume remained high during this consolidation (green arrows). This showed continued buying pressure. PGR broke resistance with good volume today and this stock is showing relative strength.

*****************************************************************
SW Airlines (LUV) is consolidating with a flat flag. Notice that the Bollinger Bands are contracting as volume remains below average. This could be the calm before the storm.

Continental Airlines (CAL) is testing support around 10. This area also acted as support in October and November.

