Charts: BA, DELL, HD, HON, INTC, K , KFT, LMT, LOW
The next update will be Friday (May 29) by 9AM ET.
Link to corresponding video.
*****************************************************************
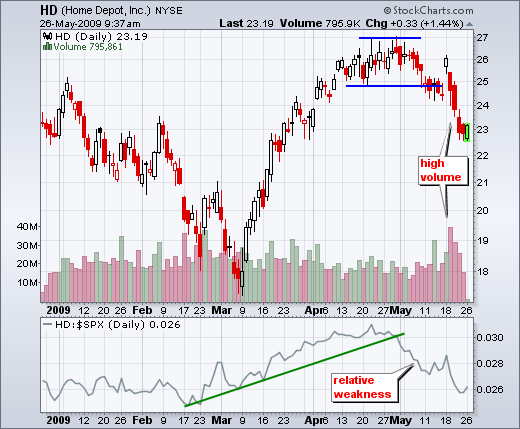
Weakness in Home Depot (HD) is negative overall. HD was hit hard with two sharp declines in May. The one-day wonder surge above 26 divides these two declines. Volume on the first decline was relatively subdued, but volume surged on the second decline. The stock is now short-term oversold after a 15% decline in May. While it may be due for an oversold bounce, I am not showing this chart for that purpose. There are two ulterior motives. First, relative weakness in this key retail stock is not a good sign overall. Second, Home Depot declined much more than its archrival last week. Who is leading whom? Will LOW follow HD lower or will HD rebound? LOW surged with big volume last Monday and then consolidated Wednesday through Friday. A break above Monday's high would be bullish and argue for a resistance challenge around 23-24.
*****************************************************************
Consumer staples stocks still show some relative strength. While many sector ETFs formed lower highs last week, the Consumer Staples SPDR (XLP) actually moved above its early May peak. Also notice that the price relative turned up over the last few week.
The next two charts come from the consumer staples sector. Kraft (KFT) and Kellogg (K) produce, market and sell food products. Both surged around three weeks ago and then consolidated the last two weeks. After a big surge above 25, Kraft formed a falling flag. Bullish flags slope down and represent a correction after an advance. KFT broke flag resistance over the last two days and this signals a continuation higher.
After surging above 43 with good volume in early May, Kellogg (K) consolidated with a pennant. The stock was overbought after this surge and needed to digest its gains. This sideways price action represents a rest that alleviates overbought conditions. A break from pennant resistance would signal a continuation higher.
*****************************************************************
Remember the WinTelDell acronym? This stood for the Windows (Microsoft), Intel and Dell trio that dominated the PC business for much of the 90's. All three companies are still around, but the new century has not been as nice. All three stocks are currently trading well below their 2000 highs. Recently, Intel (INTC) tried to break above its 200-day moving average in early May, but failed to hold the breakout and declined to support around 15. After a rising flag bounce back above 15.5, the stock broke flag support with a gap down last week. With a bounce early Tuesday, INTC is showing some resilience at support from the April-May lows. However, the flag break and gap remain. A move above 15.6 is needed to fill this gap. Barring such a move, a break below support would be bearish.
Dell Computer (DELL) also took a hit in early May and bounced with a rising flag/wedge. The stock broke wedge support with a gap down last week and this is bearish until proven otherwise. DELL is showing some resilience with a bounce early Tuesday, but it is not quite enough to negate last week's wedge break. First, it is still early Tuesday and we have yet to see where prices will end up by the close. Second, volume on the downside has been outpacing volume on the upside. Let's see if DELL can close above 11.3 before negating this wedge break.
Microsoft (MSFT) is an interesting case because the company will be releasing Windows 7 later this year. Good reviews could boost PC sales, which would obviously benefit Intel and Dell. Be careful with these fundamental arguments though. On the price chart, MSFT surged from early march to late April and then consolidated with a triangle the last few weeks. The stock is getting a bounce with the rest of the market early Tuesday and follow through above triangle resistance would be bullish.
*****************************************************************
The next charts show three stocks from the industrials sector with the Commodity Channel Index (CCI). Lockheed Martin (LMT), Boeing (BA) and Honeywell (HON) are trading near resistance after sizable advances from early March to early May. This makes them vulnerable to a correction, which would involve a pullback or a consolidation. The Commodity Channel Index (CCI) is shown with its 5-day SMA (blue line) to smooth out the jagged edges. I have also drawn trendlines based on the smoother 5-day SMA. A signal is triggered when the 5-day SMA crosses the trendline and the zero line. For Boeing, three CCI trendlines capture the last three moves in the stock. The 5-day SMA for CCI broke the up trendline recently, but remains above 50 and has yet to complete the signal. Further weakness below 50 would be bearish.
The CCI trendlines for Lockheed Martin (LMT) produced signals in January (down) and March (up). After the March signal, the indicator hovered above the zero line in April and May (flat trend). It was not possible to draw a sloping trendline so I must default to the zero line for the next signal. Even though the uptrend slowed in May, a breakdown has yet to occur as long as the indicator remains in positive territory.
Honeywell (HON) has been a little more erratic over the last five weeks and this is reflected in the Commodity Channel Index (CCI). There was a spike below zero in the indicator, but the 5-day SMA held above zero because of the smoothing. Even though the advance slowed from late March to early May, CCI remained above the zero line and relatively flat. Momentum favored the bulls as long as CCI remained positive. I will be watching the 5-day SMA for CCI. A move into negative territory would be bearish for Honeywell.
*****************************************************************


