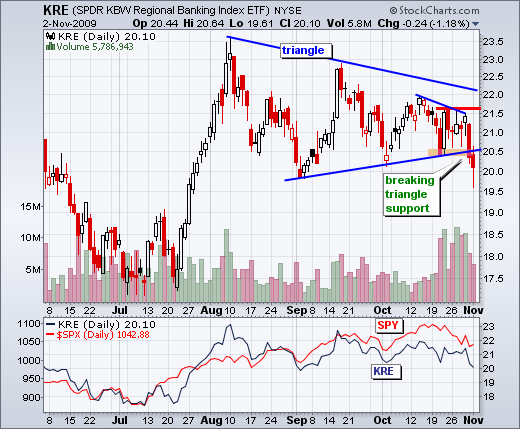
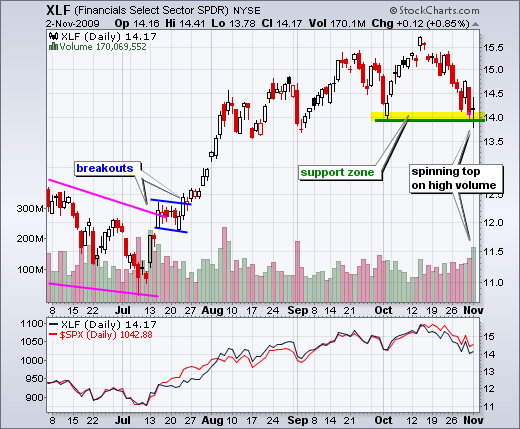
-KRE breaks support and XLF tests support
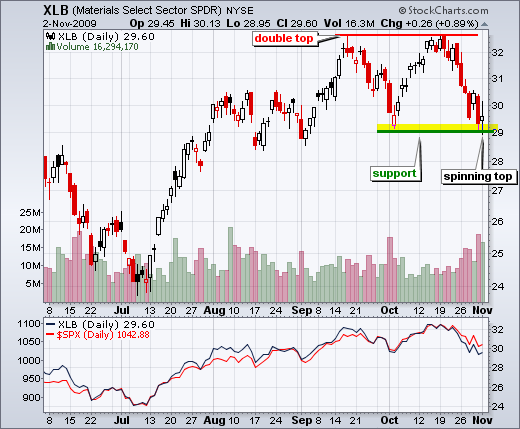
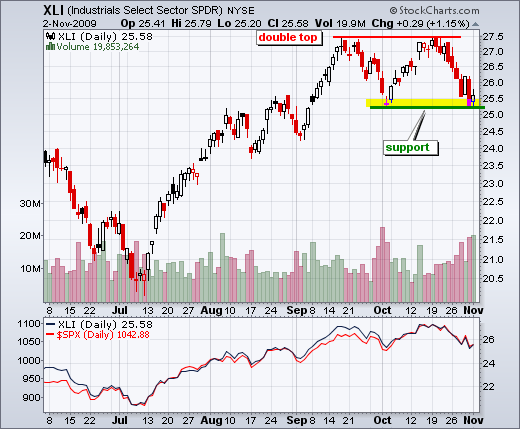
-XLB and XLI hit double top support
-BBY forms bullish falling wedge
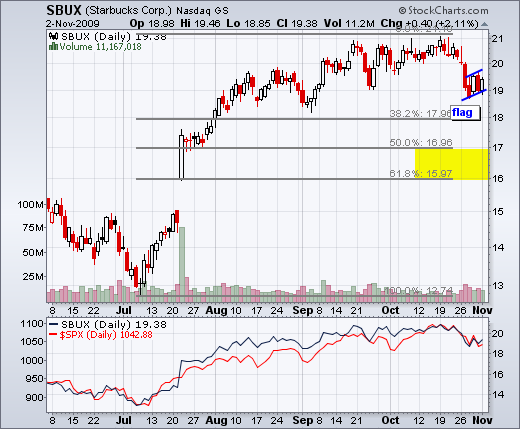
-Bear flags/pennants for JWM, LTD, RL and SBUX
****************************************************************
Regional Bank ETF Breakdown
The Regional Bank SPDR (KRE) was showing some relative strength by holding above support last week. No more. KRE broke below its October lows with a fairly sharp decline the last two days. Note that SPY remains above its October lows, which means that KRE is now showing relative weakness. This breakdown bodes ill for the finance sector and the market overall. The second chart shows the Financials SPDR (XLF) testing support from the early October low with a high-volume spinning top.
*****************************************************************
Big Support Tests for XLB and XLI
John Murphy and I pointed out double top formations in the Materials SPDR (XLB) and Financials SPDR (XLF) last week. With further weakness on Friday and indecision on Monday, both are now testing double top support. Based on classic technical analysis, a double top is confirmed with a break below support. The height of the pattern is subtracted from the support break for a downside target. Even though support breaks would be technically bearish, both are getting short-term oversold and ripe for some sort of oversold bounce or consolidation. It is also worth noting that XLV and XLU are also testing key support levels.
*****************************************************************
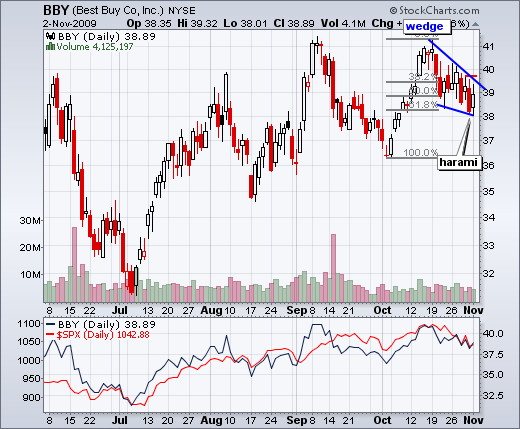
Best Buy Forms Falling Wedge
Best Buy (BBY) surged to resistance in earl October and fell back with the stock market over the last two weeks. However, BBY remains well above its early October low and is holding up better than SPY since mid October. The short-term trend is down as long as the wedge falls. BBY formed a harami near the 62% retracement mark on Friday-Monday. A follow through breakout would be bullish.
*****************************************************************
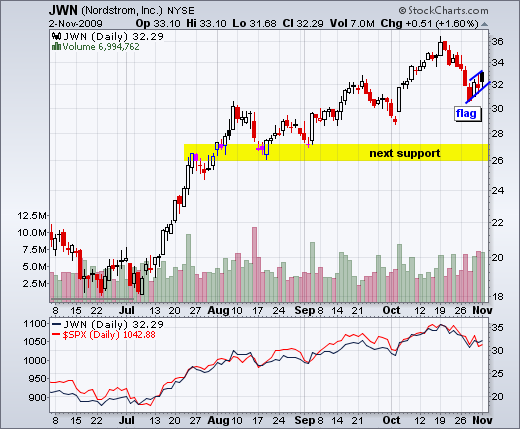
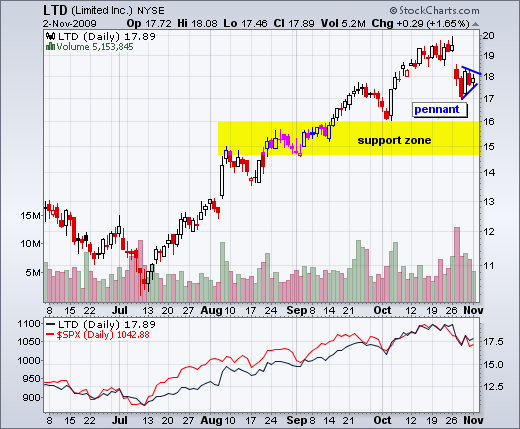
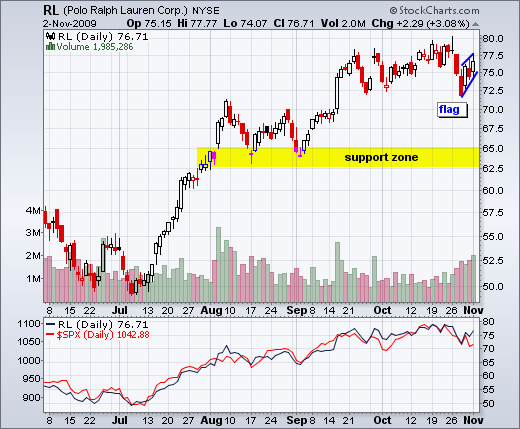
Bear Flags and Pennants
The next four stocks come from the consumer discretionary sector, retail in particular. All three were hit hard in late October and then consolidated over the last 4 days. Three formed rising flags and one formed a pennant. These are short-term continuation patterns that signal a rest after a sharp move. A break below flag/pennant support would signal a continuation lower with a target to the next support area.

