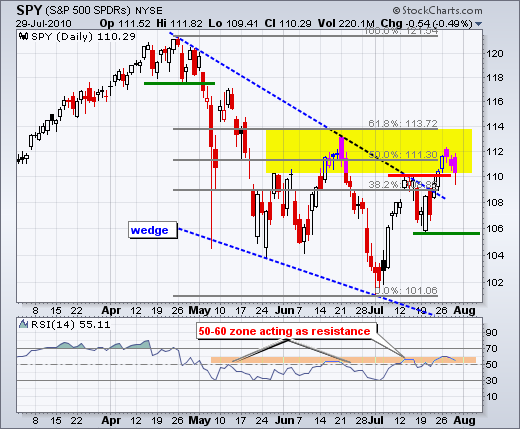
Even though the July surge had impressive breadth and upside momentum, the S&P 500 ETF (SPY) is clearly running into resistance around 112. Resistance from prior highs and key retracements is not surprising. In addition, the ETF became overbought early this week after a 10% advance in 17 days. RSI is also having trouble in the 50-60 zone. A pullback or consolidation over the next 1-2 weeks would be quite normal. Will this be just a shallow correction or another sharp swing lower? That, of course, is the 64 cent question. Frankly, I can make arguments either way. Volatility has been exceptionally high since early May. As noted in the Market Message, SPY has seen six 8% swings since late April (14 weeks). That is one 8% swing every 2.33 weeks. The current upswing is now four weeks old, which is ancient by those standards. The evidence is here for a pullback, but we never know just how far. I will keep an eye on the 60-minute chart for signs of a short-term reversal.


On the 60-minute chart, SPY gapped up twice this week and declined after each gap. These failed gaps reflect bullish fatigue, but the actual uptrend has yet to reverse. With yesterday's sharp decline and afternoon bounce, I am marking short-term support at 109. The July trendline and afternoon low confirm support here. A break below this level would reverse the short-term uptrend and call for at least a retracement of the July advance. RSI is hinting at trouble with a dip below 40 yesterday. The momentum oscillator rebounded by the close, but another dip below 40 would clearly turn short-term momentum bearish. Looking ahead, next week is big on the economic front. The week starts with the ISM Indices and ends with the employment report

Key Economic Reports:
Fri - Jul 30 - 08:30 - GDP
Fri - Jul 30 - 09:45 - Chicago PMI
Fri - Jul 30 - 09:55 - U Michigan Sentiment
Charts of Interest: None today.
This commentary and charts-of-interest are designed to stimulate thinking. This analysis is not a recommendation to buy, sell, hold or sell short any security (stock ETF or otherwise). We all need to think for ourselves when it comes to trading our own accounts. First, it is the only way to really learn. Second, we are the only ones responsible for our decisions. Think of these charts as food for further analysis. Before making a trade, it is important to have a plan. Plan the trade and trade the plan. Among other things, this includes setting a trigger level, a target area and a stop-loss level. It is also important to plan for three possible price movements: advance, decline or sideways. Have a plan for all three scenarios BEFORE making the trade. Consider possible holding times. And finally, look at overall market conditions and sector/industry performance.

About the author:
Arthur Hill, CMT, is the Chief Technical Strategist at TrendInvestorPro.com. Focusing predominantly on US equities and ETFs, his systematic approach of identifying trend, finding signals within the trend, and setting key price levels has made him an esteemed market technician. Arthur has written articles for numerous financial publications including Barrons and Stocks & Commodities Magazine. In addition to his Chartered Market Technician (CMT) designation, he holds an MBA from the Cass Business School at City University in London.
Learn More