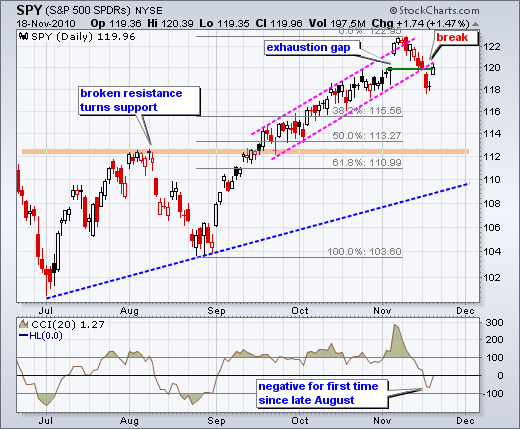
The Euro got an oversold bounce and bonds moved lower. Stocks also got an oversold bounce, but did not do much after the opening gap. SPY broke channel support with a gap down and long red candlestick on Tuesday. The ETF was oversold after this decline and firmed with a doji on Wednesday. Thursday's gap and advance 1.47% advance were strong, but I think this is part of either a trading range or a bigger pullback. I would not call the 3-day pattern a morning doji star because the doji's open did not produce a gap down.
Even though the bulk of the short-term evidence is bearish, picking tops or timing pullbacks after a strong advance is tricky business. First, we are in the seasonally bullish period of the year (Nov to Apr). Second, we are near yearend and underinvested portfolio managers may buy the dips. Third, tops often evolve with some sort of consolidation or sideways action. Fourth, the bigger trend is still and this is considered a correction within that bigger uptrend, which holds the trump cards. Fifth, the Fed has opened the flood gates.
On the 60-minute chart, SPY alleviated oversold conditions and is now at its first resistance challenge. The ETF retraced 50% of the prior advance with the morning surge and then stalled. RSI surged to 60 and also stalled. This is the first make-or-break point for the bulls. Follow through above 120.5 would give way to a bigger bounce towards the early November highs. Should an extended downtrend be underway, I would expect the current peak to hold and prices to start moving lower again. Note that Bernanke is speaking today (5:15AM ET) at the European Central Bank Central Banking Conference in Frankfurt. Maybe he will have a Hefeweizen before hand.

Key Economic Reports:
Nov 18 - 10:00 - Philadelphia Fed Survey
Nov 19 - 05:15 – Bernanke Speaks
Charts: Tuesday and Thursday in separate post.
-----------------------------------------------------------------------------
This commentary and charts-of-interest are designed to stimulate thinking. This analysis is not a recommendation to buy, sell, hold or sell short any security (stock ETF or otherwise). We all need to think for ourselves when it comes to trading our own accounts. First, it is the only way to really learn. Second, we are the only ones responsible for our decisions. Think of these charts as food for further analysis. Before making a trade, it is important to have a plan. Plan the trade and trade the plan. Among other things, this includes setting a trigger level, a target area and a stop-loss level. It is also important to plan for three possible price movements: advance, decline or sideways. Have a plan for all three scenarios BEFORE making the trade. Consider possible holding times. And finally, look at overall market conditions and sector/industry performance.

About the author:
Arthur Hill, CMT, is the Chief Technical Strategist at TrendInvestorPro.com. Focusing predominantly on US equities and ETFs, his systematic approach of identifying trend, finding signals within the trend, and setting key price levels has made him an esteemed market technician. Arthur has written articles for numerous financial publications including Barrons and Stocks & Commodities Magazine. In addition to his Chartered Market Technician (CMT) designation, he holds an MBA from the Cass Business School at City University in London.
Learn More
