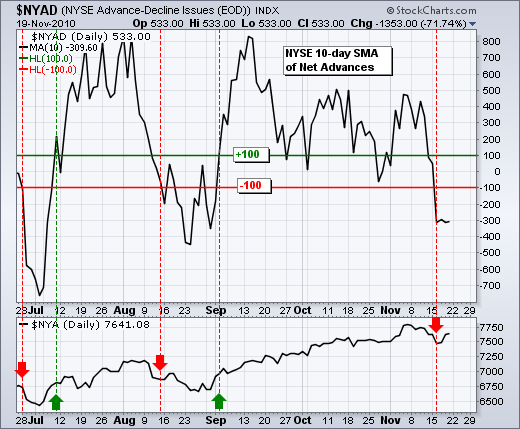
Ireland accepted an aid package and the Euro is getting a bounce this morning. It is not a huge bounce though. Euro strength could give US equities a lift as we head into Thanksgiving. It is a shortened week with three full trading days (Mon-Tue-Wed) and a short day on Friday. Historically, Wednesday and Friday have been up days for the stock market. My short-term breadth indicators turned bearish last week. It is unclear if this turn will mark an extended decline, a choppy trading range or a short pullback. For now, these indicators remain in bear mode. To recap: the four indicators are the 10-day SMAs for the AD Line and AD Volume Line of the NYSE and Nasdaq. A bull signal is in force when these indicators move above +100. A bear signal is in force when they move below -100. The chart below shows the 10-day SMA for the NYSE AD Line moving below -100 for the first time since 1-Sep. This bearish signal would be reversed with a move above +100.
On the daily chart, SPY broke channel support with a gap last Tuesday, but the bulls answered back with a gap on Thursday. Even though this is not a morning doji star, a short-term bullish reversal of sorts has taken place. The medium-term trend on the daily chart is still up and this decline was viewed as a pullback with this bigger uptrend. In Friday's Market Message I showed the potential for a flat (ABC) or a triangle (ABCDE) to evolve over the next few weeks. This is based on the Elliott Wave theory of alternation. Wave 2 and Wave 4 should alternate. Wave 2 was a simple zigzag (ABC) in August. Therefore, Wave 4 should be a flat or triangle. These are sideways patterns or trading ranges.

Picking tops or timing pullbacks after a strong advance is tricky business. First, it is the seasonally bullish period of the year (Nov to Apr). Second, we are near yearend and underinvested portfolio managers may buy the dips. Third, tops often evolve with some sort of consolidation or sideways action. Fourth, the bigger trend is still up and this is considered a correction within that bigger uptrend, which holds the trump cards. Fifth, the Fed has opened the monetary flood gates.
On the 60-minute chart, SPY broke above the blue trendline with a gap and is holding the breakout and the gap. Even though SPY is near the yellow resistance zone and RSI is trading at resistance (60), the uptrend on the daily chart and Thursday's gap/breakout on the 60-minute chart seem to dominate the situation right now. At this point, we can establish short-term support just above 119. A move below the Thursday-Friday lows would reverse this breakout. A break below 50 in RSI would turn momentum bearish again.

Key Economic Reports:
Tue - Nov 23 - 08:30 - GDP Estimate
Tue - Nov 23 - 14:00 - Minutes of FOMC Meeting
Wed - Nov 24 - 07:00 - MBA Mortgage Applications
Wed - Nov 24 - 08:30 - Personal Income
Wed - Nov 24 - 08:30 - Durable Orders
Wed - Nov 24 - 08:30 - Initial Claims
Wed - Nov 24 - 09:55 - Michigan Sentiment
Wed - Nov 24 - 10:00 - New Home Sales
Wed - Nov 24 - 10:30 - Crude Inventories
Thu – Nov 25 – 09:00 - Thanksgiving
Fri – Nov 26 – 09:00 – Market Closes at 1PM ET
Charts: Tuesday and Thursday in separate post.
-----------------------------------------------------------------------------
This commentary and charts-of-interest are designed to stimulate thinking. This analysis is not a recommendation to buy, sell, hold or sell short any security (stock ETF or otherwise). We all need to think for ourselves when it comes to trading our own accounts. First, it is the only way to really learn. Second, we are the only ones responsible for our decisions. Think of these charts as food for further analysis. Before making a trade, it is important to have a plan. Plan the trade and trade the plan. Among other things, this includes setting a trigger level, a target area and a stop-loss level. It is also important to plan for three possible price movements: advance, decline or sideways. Have a plan for all three scenarios BEFORE making the trade. Consider possible holding times. And finally, look at overall market conditions and sector/industry performance.

