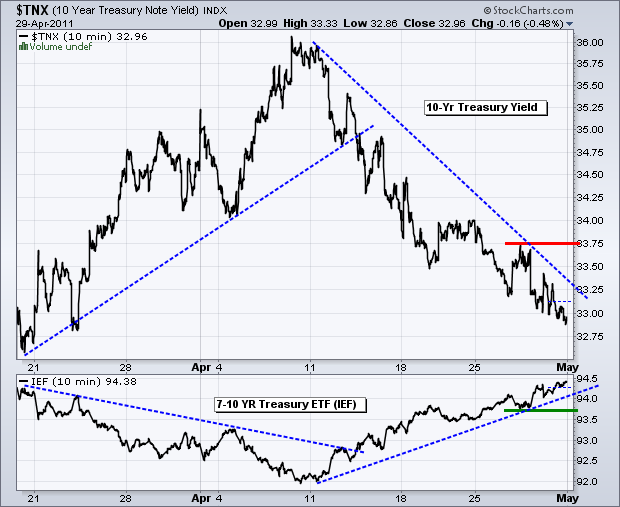
It is a strange pairing, but stocks and bonds are both in strong uptrends. We can also throw in strong uptrends for gold, oil and the Euro. The Dollar is the one left out in the cold with a strong downtrend. The rally in bonds is a bit perplexing. QE2 is supposedly coming to an end, Bond king Bill Gross of PIMCO has abandoned US Treasuries, the economy appears strong and inflation seems more likely than deflation at this point. Bonds should be down in such an environment. This is why the fundamentals are on the back burner and the technicals are at the forefront. The chart below shows the 10-year Treasury Yield ($TNX) moving from 36 to 33 (3.6% to 3.3%) over the last three weeks. A clear downtrend is present with resistance at 33.75. The 7-10 year Bond ETF (IEF), which moves opposite yields, has been trending higher with support now at 93.70.

There is no change on the daily chart. SPY broke neckline resistance of an inverse head-and-shoulders pattern. There was a two-day stall in the neckline and then four white candlesticks. The ETF is now up 4.5% in 8 days and 6.5% since the mid March low. Broken resistance around 133-134 turns into the first support zone to watch. The indicator window shows StochRSI remaining above .80. Notice how this indicator remained above .80 from March 24 to April 7 as the ETF stayed strong. This is a classic case of becoming overbought and remaining overbought in a strong short-term uptrend. A move below .50 would provide the first sign of weakness in short-term momentum.

There is no change on the 60-minute chart, which shows a falling flag breakout with the gap above 133. The flag target is to around 138.5 (129.5 + 9 = 138.5). RSI moved into bull mode with the surge above 65 on April 20th and remains bullish until a break below 35.

Key Economic Reports/Events:
Mon - May 02 - 10:00 - Construction Spending
Mon - May 02 - 10:00 - ISM Manufacturing Index
Mon - May 02 - 15:00 - Auto/Truck Sales
Tue - May 03 - 10:00 - Factory Orders
Wed - May 04 - 07:00 - MBA Mortgage Index
Wed - May 04 - 08:15 - ADP Employment Report
Wed - May 04 - 10:00 - ISM Services
Wed - May 04 - 10:30 - Oil Inventories
Thu - May 05 - 08:30 - Jobless Claims
Fri - May 06 - 08:30 - Employment Report
Fri - May 06 - 15:00 - Consumer Credit
Charts of Interest: Tuesday and Thursday in separate post.
-----------------------------------------------------------------------------
This commentary and charts-of-interest are designed to stimulate thinking. This analysis is not a recommendation to buy, sell, hold or sell short any security (stock ETF or otherwise). We all need to think for ourselves when it comes to trading our own accounts. First, it is the only way to really learn. Second, we are the only ones responsible for our decisions. Think of these charts as food for further analysis. Before making a trade, it is important to have a plan. Plan the trade and trade the plan. Among other things, this includes setting a trigger level, a target area and a stop-loss level. It is also important to plan for three possible price movements: advance, decline or sideways. Have a plan for all three scenarios BEFORE making the trade. Consider possible holding times. And finally, look at overall market conditions and sector/industry performance.
