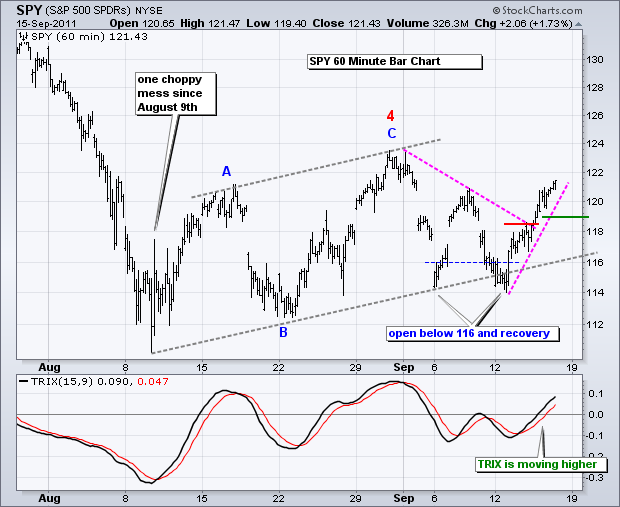
As noted earlier, I view the decline from late July to early August as an impulse move. This means it is a strong move that is part of a bigger trend. In this case it is down. The choppy advance since the second week of August looks like a corrective move. This means it is a relatively weak move that runs counter to the bigger trend, which is down. Just google "impulse corrective wave" and you will get plenty of hits explaining this concept. At some point, the bigger trend is expected to prevail. Picking that point is, of course, the million dollar question. Stocks extended their short-term advance on Thursday and there is not much change on the charts. The S&P 500 ETF (SPY) has gone nowhere since August 9th. The gray trendlines mark this rising flag. Short-term, the swings within the flag are dictating policy. With a break above 118.50 on Wednesday, the short-term swing is up and I am marking support at 119. I will slowly raise support as this short-term advance extends. A move below this level would signal the start of a downswing. TRIX is currently moving higher to confirm the current upswing. A move below the signal line would signal a short-term reversal. Keep in mind that this commentary is short-term oriented (1-4 weeks). This means the trends and signals are subject to change quite often.


The 20+ year Bond ETF (TLT) broke below the lower trendline of the triangle pattern. While negative, the ETF remains above support from last week's lows. Support in the 111 area is also marked by the trendline extending up from the late July low. Bonds are likely to turn volatile the next week as the FOMC meeting begins on the 20th.

The US Dollar Fund (UUP) got hammered after the European Central Bank (ECB) announced a coordinated capital-injection into under-capitalized European banks. This news sent the the Euro, the German DAX Index ($DAX), the French CAC Index ($CAC) and French banking stocks sharply higher. UUP declined with what still looks like a corrective move. I view the surge from late August to early September as an impulse move, perhaps a Wave-1. This week's decline is corrective, perhaps Wave-2. The 50% retracement zone is around 21.50. Look for a break above the channel trendline to signal an end to the correction.

There is no change in USL. Oil remains surprisingly strong as the 12-Month US Oil Fund (USL) challenges resistance from the Ascending Triangle pattern. Oil is rising despite weakness in European stocks and a surge in the Dollar the last two weeks. A breakout would target further strength to the 43-44 area. Key support is at 38.50.

The relationship between gold and the Dollar is a little out of whack lately. Gold surged as the Dollar bottomed in late August and moved higher in early September. The Dollar declined this week and Gold declined along with the greenback. These two are usually not positively correlated. The Gold SPDR (GLD) broke support and remains in a clear downtrend since late week. Resistance is marked at 180. The next support is in the 166-168 area.

Key Economic Reports:
Fri - Sep 16 - 09:00 - Net Long-Term TIC Flows
Fri - Sep 16 - 09:55 - Michigan Sentiment
Charts of Interest: Tuesday and Thursday in separate post.
This commentary and charts-of-interest are designed to stimulate thinking. This analysis is not a recommendation to buy, sell, hold or sell short any security (stock ETF or otherwise). We all need to think for ourselves when it comes to trading our own accounts. First, it is the only way to really learn. Second, we are the only ones responsible for our decisions. Think of these charts as food for further analysis. Before making a trade, it is important to have a plan. Plan the trade and trade the plan. Among other things, this includes setting a trigger level, a target area and a stop-loss level. It is also important to plan for three possible price movements: advance, decline or sideways. Have a plan for all three scenarios BEFORE making the trade. Consider possible holding times. And finally, look at overall market conditions and sector/industry performance.

