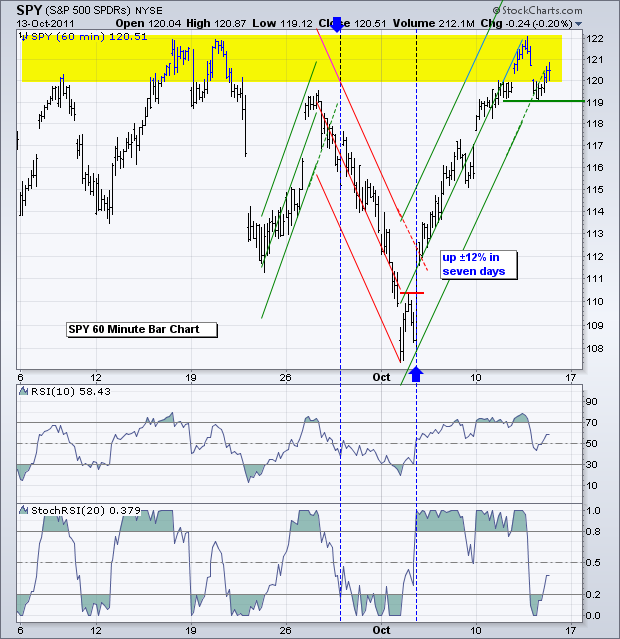
Upside momentum is weakening in the stock market, but the short-term swing remains up and we have yet to see an actual breakdown. There is often a pecking order to a trend reversal, even a short-term trend reversal. The short-term trend has been up since the breakouts last Tuesday (October 4th). StochRSI is the most sensitive indicator and will be the first to trigger a bearish momentum signal with a plunge below .20. StochRSI for IWM, QQQ and SPY moved below .20 this week. The more sensitive an indicator, the more prone it will be to whipsaws and false signals. RSI is usually the second indicator to trigger with a break below 50. A move below the Raff Regression Channel extension is the third signal and a support break is the final signal. This means there are four items to watch on the charts: StochRSI, RSI, the Raff Regression Channel extension and support. SPY broke below the Raff Regression Channel extension with a move lower early Thursday, but bounced in the afternoon to affirm support at 119. This is now the level to watch for a trend reversal. A move below 119 would likely coincided with a second RSI break below 50. StochRSI already moved below .20 to trigger an early signal and will remain bearish unless there is a move back above .80. Retail Sales will be reported this morning before the market open. With retail spending driving over 1/2 of GDP, this report could affect the market overall and especially the consumer discretionary sector.
**************************************************************************
Bill Gross is now bullish on long-term Treasuries and expects long-term rates to move lower. Gross was also bearish from July to September, which is when the 20+ year Bond ETF (TLT) surged over 20%. Will Gross be dead wrong again? The moral of the story: Gurus are just like you and me. They will be right sometimes and wrong sometimes. It is OK to read other analysis for clues, but we all need to think for ourselves and make our own decisions. TLT remains in corrective mode as stocks remain in a short-term upswing. TLT bounced above the trendline extending down from last week's high, but did not clear resistance at 117. This remains the level to beat. I would not expect bonds to turn higher unless stocks move lower.
**************************************************************************
The US Dollar Fund (UUP) remains in a downswing as a falling price channel takes shape. The decline has retraced around 50% of the prior advance. With the bigger trend up, I am still expecting support and a reversal in this area. A move above 22 would break the upper trendline of this channel. Also watch for the Euro Currency Trust (FXE) to break support at 135 to confirm.
**************************************************************************
Even though stocks remain firm and the Dollar remains weak, oil moved lower the last two days. The US Oil Fund (USO) broke the Raff Regression Channel extension and then support at 32.50. Also note that StochRSI moved below .20 and RSI moved below 50. The short-term signals are all bearish on this chart. However, the stock market has yet to confirm with a breakdown and the Dollar has yet to turn up. A little help from these two is needed to confirm the breakdown in oil.
**************************************************************************
There is not much change in the Gold SPDR (GLD). The ETF remains in a choppy uptrend since late September, but this advance looks like a rising flag on the daily chart. Weakness in the Dollar is helping gold move higher. An upturn in the greenback would be negative for bullion. Notice how gold dropped when the Dollar opened higher on Thursday and then edged higher as the Dollar edged lower.
**************************************************************************
Key Economic Reports:
Fri - Oct 14 - 08:30 - Retail Sales
Fri - Oct 14 - 09:55 - Michigan Sentiment
Fri - Oct 14 - 10:00 - Business Inventories
Sun – Oct 17 – 10:00 – European Debt Summit
Charts of Interest: Tuesday and Thursday in separate post.
This commentary and charts-of-interest are designed to stimulate thinking. This analysis is not a recommendation to buy, sell, hold or sell short any security (stock ETF or otherwise). We all need to think for ourselves when it comes to trading our own accounts. First, it is the only way to really learn. Second, we are the only ones responsible for our decisions. Think of these charts as food for further analysis. Before making a trade, it is important to have a plan. Plan the trade and trade the plan. Among other things, this includes setting a trigger level, a target area and a stop-loss level. It is also important to plan for three possible price movements: advance, decline or sideways. Have a plan for all three scenarios BEFORE making the trade. Consider possible holding times. And finally, look at overall market conditions and sector/industry performance.


