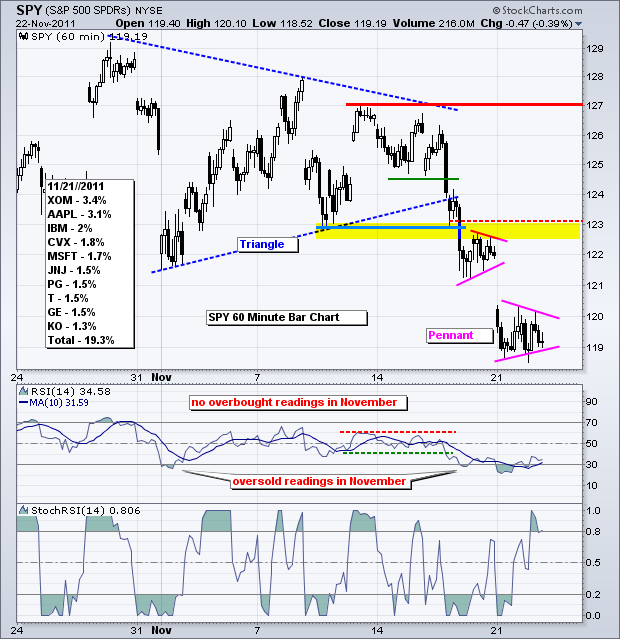
The stock market can fall simply from a lack of buying pressure. In other words, it does not always take an increase in selling pressure to produce a decline. It is pretty easy to come up with reasons not to buy. The major index ETFs broke support levels with sharp declines the last seven days. The finance sector and big banks are leading the way down. Europe remains a mess and the major European indices are breaking down fast. The US government is dysfunctional and black Friday now starts before Thanksgiving. Forget about the January affect, it happened in October! China is slowing and the emerging market indices are getting creamed. The outlook is downright bleak for the bulls. On the S&P 500 ETF (SPY) chart, the ETF plunged, formed a pennant, plunged again and formed another pennant on Tuesday. This consolidation works off some of the short-term oversold conditions. A break below pennant support would signal another continuation lower. While Tuesday's highs mark first resistance and a little breakout would be short-term positive, I would not consider it anything more than an oversold bounce. The first significant resistance level resides around 123, which is marked by broken support and Friday's pennant. Programming note: Art's charts will not be published on Friday. Happy Thanksgiving!


**************************************************************************
The 20+ year Bond ETF (TLT) continued higher with a surge above 121. This move is a bit surprising because stocks actually firmed on Tuesday. Money is still seeking relative safety to ride out the storm. Strength in Treasuries also hints at economic weakness (recession?) and QE3. Broken resistance turns first support in the 118-119 area. Key support remains at 115.

**************************************************************************
The US Dollar Fund (UUP) pulled back after a strong open, but remains in an uptrend overall. More importantly, the first support zone in the 21.8-21.9 area is holding. A move below 21.80 would be negative and could provide a boost to the stock market. Let's see it happen first though.

**************************************************************************
The US Oil Fund (USO) extended its bounce with a push above 38, but could not hold these gains and fell back by the close. I think this is just an oversold bounce akin to a rising flag. A break below support at 37.3 would signal a continuation lower and target a move to the next support zone around 36. RSI broke support at 40 with the most recent decline. This puts momentum in bear mode and the 50-60 zone now marks resistance.

**************************************************************************
Gold is certainly tempting because it is a hard asset and a currency alternative. Also gold managed a gain even as the stock market moved sideways on Tuesday. Perhaps the small decline in the Dollar helped gold. The Gold SPDR (GLD) surged above 165 and broke a steep trendline. Playing such a breakout is for bottom pickers because the 2-3 week trend is down and GLD was oversold. Note that stock futures, the Euro and gold futures are down overnight (early Wednesday AM). I am not convinced that gold has divorced itself from the stock market. GLD needs to hold 164 for this little surge to hold. Otherwise, the bigger downtrend rules and the next big support zone is in the 155-157 area.

**************************************************************************
Key Economic Reports:
Wed - Nov 23 - 07:00 - MBA Mortgage Index
Wed - Nov 23 - 08:30 - Initial Claims
Wed - Nov 23 - 08:30 - Personal & Spending
Wed - Nov 23 - 08:30 - Durable Orders
Wed - Nov 23 - 09:55 - Michigan Sentiment
Wed - Nov 23 - 10:30 - Oil Inventories
Thu – Nov 24 – 10:00 – Thanksgiving!!
Charts of Interest: Tuesday and Thursday in separate post.
This commentary and charts-of-interest are designed to stimulate thinking. This analysis is not a recommendation to buy, sell, hold or sell short any security (stock ETF or otherwise). We all need to think for ourselves when it comes to trading our own accounts. First, it is the only way to really learn. Second, we are the only ones responsible for our decisions. Think of these charts as food for further analysis. Before making a trade, it is important to have a plan. Plan the trade and trade the plan. Among other things, this includes setting a trigger level, a target area and a stop-loss level. It is also important to plan for three possible price movements: advance, decline or sideways. Have a plan for all three scenarios BEFORE making the trade. Consider possible holding times. And finally, look at overall market conditions and sector/industry performance.
