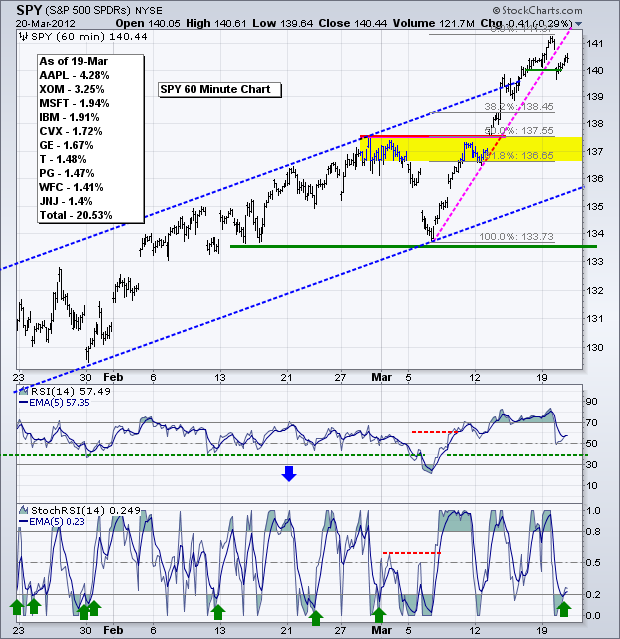
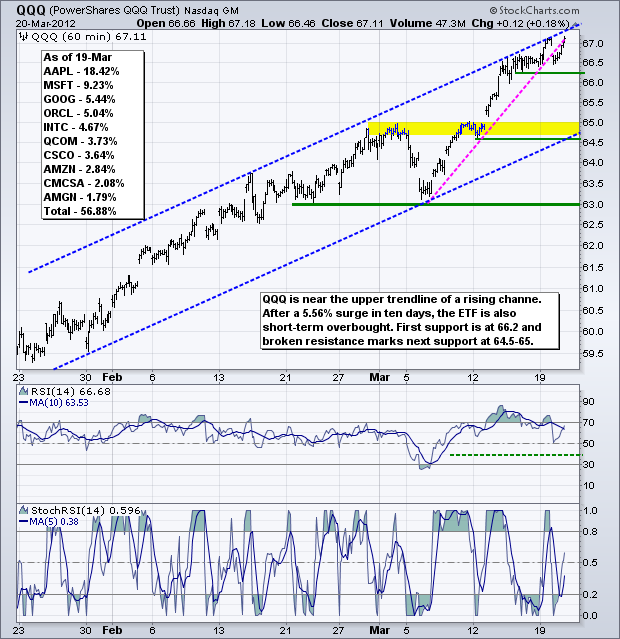
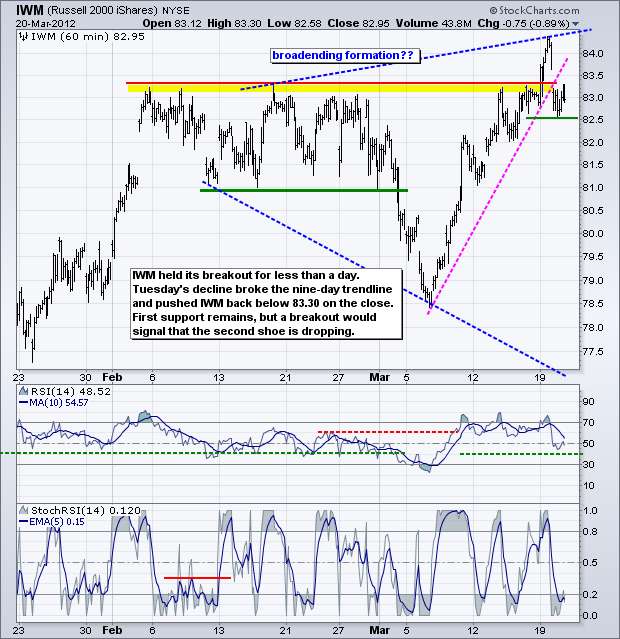
Stocks were hit with selling pressure on the open, but the major index ETFs worked their way higher the rest of the day. The S&P 500 ETF (SPY) opened around 140 and worked its way to the 140.60 area by the afternoon. On the 10-minute chart, this six hour advance looks like a rising flag or channel that retraced 50-61.80% of the decline from Monday afternoon to Tuesday morning. This is an extremely short-term setup, but a break below 140.20 would be the first sign of a continuation lower. For now, this bounce could simply continue because SPY became oversold on the 60-minute chart. Notice how StochRSI moved to zero and its 5-day EMA moved below .20, which shows short-term oversold conditions. Also notice that 14-day RSI bounced around 50, which is the centerline. Even though these short-term indicators point to a bounce, caution is still warranted because SPY remains overbought on a two week timeframe and a three-to-four month timeframe. Programming note: "The Song Remains the Same" was a little reference from Led Zeppelin (circa 1973).
**************************************************************************
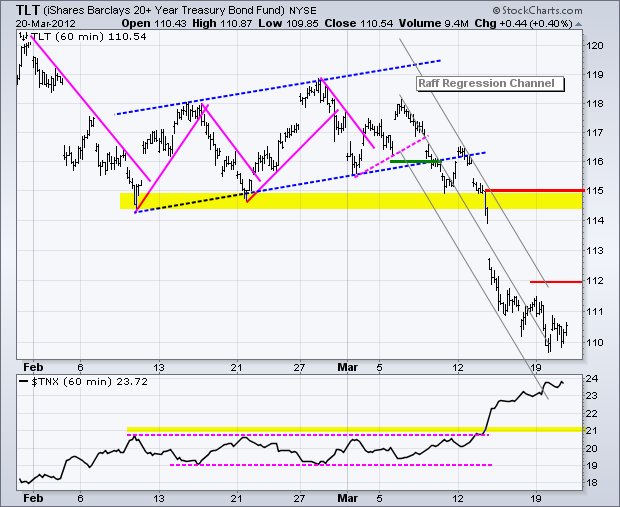
The decline in 20+ Year T-Bond ETF (TLT) is so steep that I am going to use the Raff Regression Channel to define the downtrend. The middle line is a linear regression and the upper line extends parallel from the 12-March high. This line ends around 112 and now marks first resistance. TLT remains as oversold as the stock market is overbought.
**************************************************************************
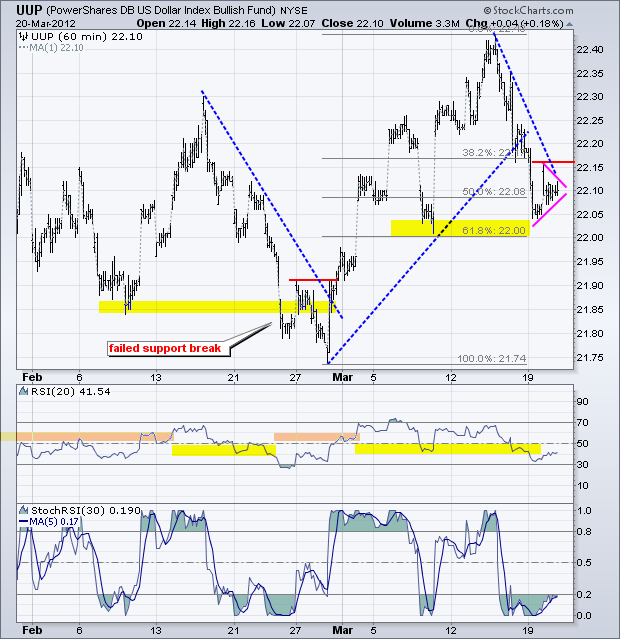
The US Dollar Fund (UUP) is near a potential support zone, but not getting a bounce. Instead of bouncing, the ETF is consolidating around the 22.10 area with what looks like a triangle or pennant. A break below 22.05 would signal a continuation lower. Resistance is marked with yesterday's high (22.16) and a break above this level is needed to reverse the downswing.
**************************************************************************
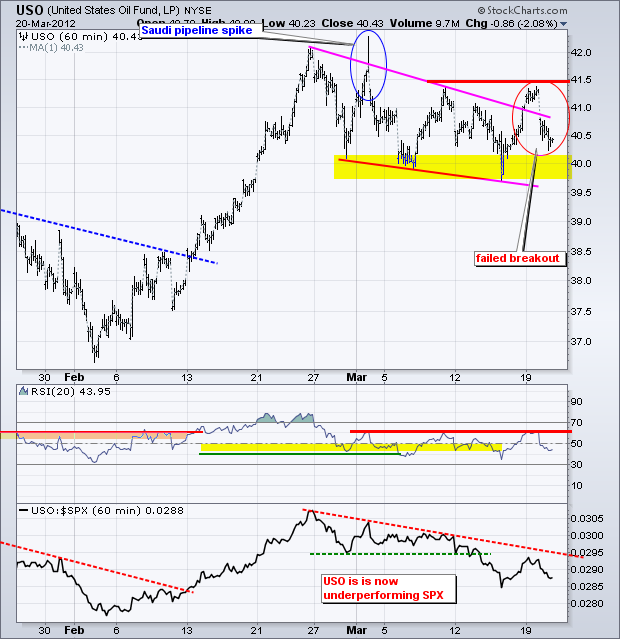
The US Oil Fund (USO) got hit hard on Tuesday after a warning from BHP on natural resource demand out of China. There may have been some geopolitical influences as well. Whatever the reasons, USO did not hold the breakout and moved quickly below 40.50 on Tuesday. This negates the breakout and puts USO back in a downtrend. USO needs to break above 41.50 and RSI needs to break above 65 to fully reverse this downtrend.
**************************************************************************
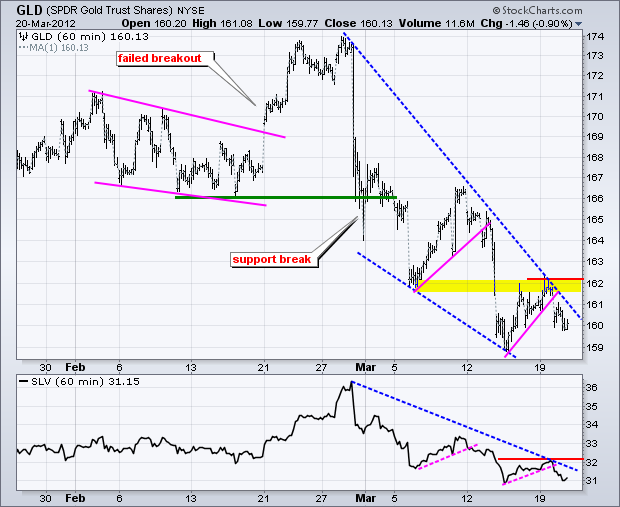
The Gold SPDR (GLD) failed at resistance in the 162 area and broke the trendline extending up from last week. It is a short 3-4 day trendline, but the break signals a continuation lower within a bigger downtrend. This also reinforces resistance in the 162 area. A move above Monday's high would break the wedge trendline and could open the door to a decent rally.
**************************************************************************
Key Economic Reports:
Wed - Mar 21 - 07:00 - MBA Mortgage Index
Wed - Mar 21 - 10:00 - Existing Home Sales
Wed - Mar 21 - 10:30 - Crude Inventories
Thu - Mar 22 - 08:30 - Initial Claims
Thu - Mar 22 - 10:00 - FHFA Housing Price Index
Thu - Mar 22 - 10:00 - Leading Indicators
Fri - Mar 23 - 10:00 - New Home Sales
Charts of Interest: Tuesday and Thursday in separate post.
This commentary and charts-of-interest are designed to stimulate thinking. This analysis is not a recommendation to buy, sell, hold or sell short any security (stock ETF or otherwise). We all need to think for ourselves when it comes to trading our own accounts. First, it is the only way to really learn. Second, we are the only ones responsible for our decisions. Think of these charts as food for further analysis. Before making a trade, it is important to have a plan. Plan the trade and trade the plan. Among other things, this includes setting a trigger level, a target area and a stop-loss level. It is also important to plan for three possible price movements: advance, decline or sideways. Have a plan for all three scenarios BEFORE making the trade. Consider possible holding times. And finally, look at overall market conditions and sector/industry performance.

