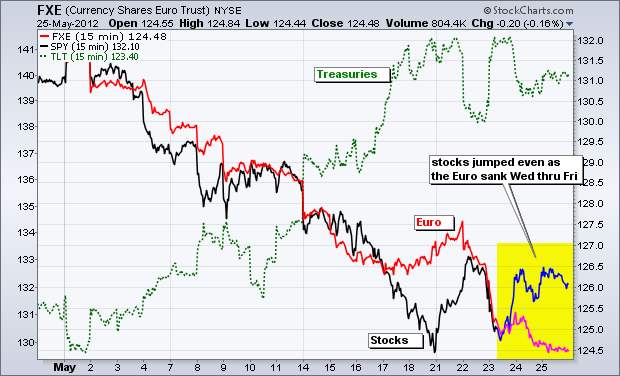
Stock futures are up sharply this morning as the world takes a small bite of risk. Stocks are higher in Asia with Shanghai and Australia up just over 1%. European stocks are higher, but only modestly so with most major indices up around .50%. Oil futures are following the risk-on rebound with a $1 gain and gold is up almost $20. I am not sure if this rally will have legs because Europe is not up that much and the Euro is only slightly higher. Also notice that treasury futures are relatively flat. A true risk-on rebound would see the Euro moving sharply higher and treasuries moving sharply higher. These two hold the key to the risk-on and risk-off trades.
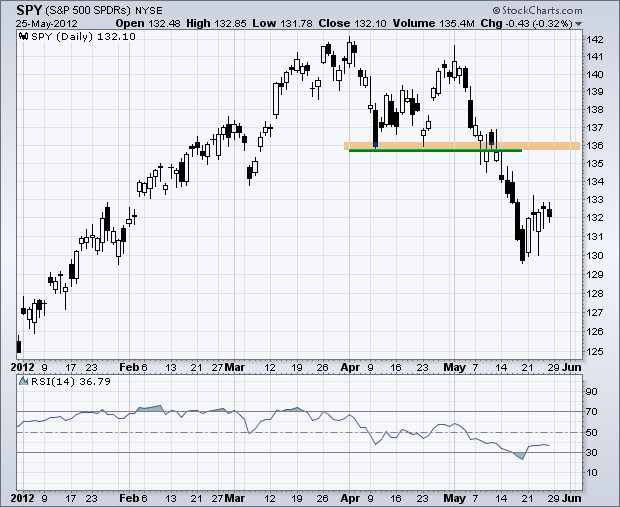
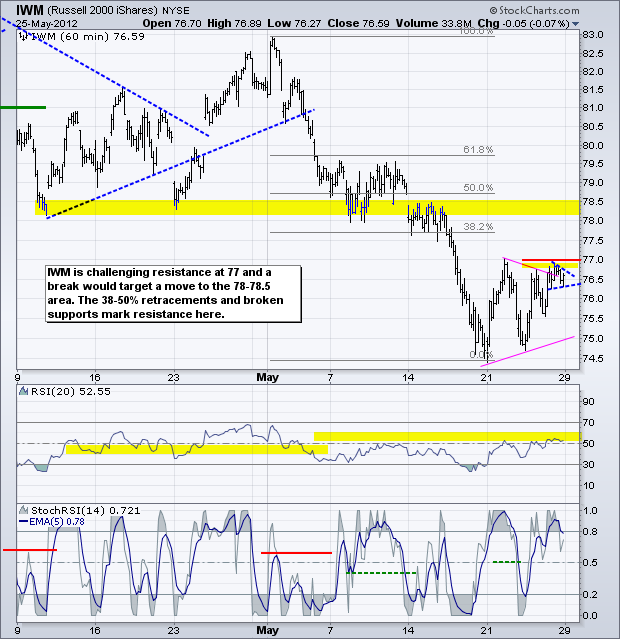
It is a huge week for economic reports. Tuesday-Wednesday are relatively light days with the Case-Shiller Housing Index, Consumer Confidence, Pending Home Sales and the Challenger Job Cuts Report. We then cram a week's worth of reports into Thursday and Friday. Jobless Claims, the ADP Employment Report and Chicago PMI are up Thursday morning. Friday kicks off with the big employment report. We can also look forward to Auto-Truck Sales, the ISM Manufacturing Survey and Construction Spending. The major index ETFs broke key support level with the May decline and will likely remain below should the majority of these reports be worse-than-expected. These broken supports now turn into resistance, which could be challenged with a slew of better-than-expected reports. A surge back above broken support, on strong breadth, would call for a reassessment of the medium-term downtrends.
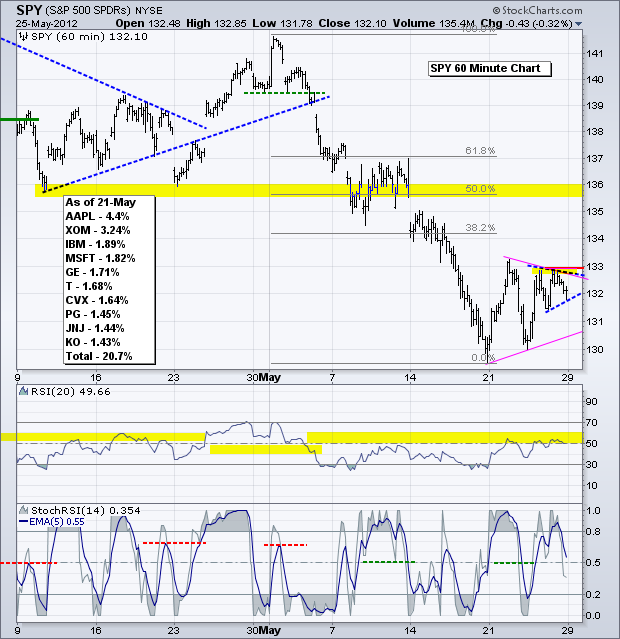
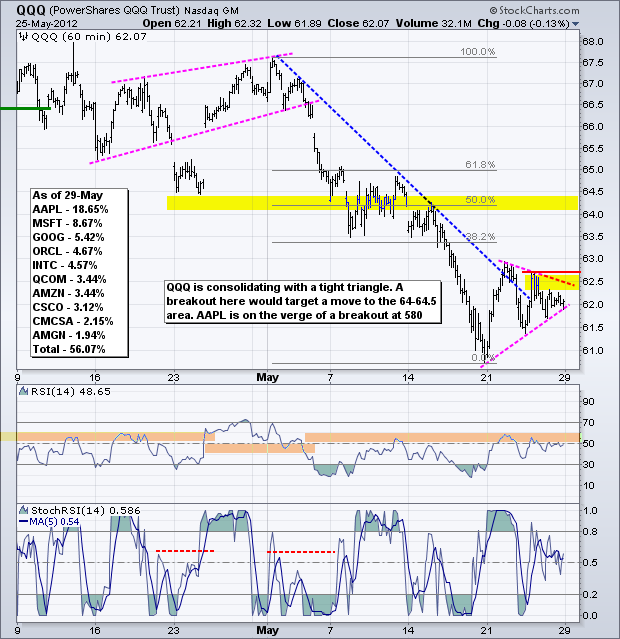
A pattern within a pattern is taking shape on the S&P 500 ETF (SPY) chart. The ETF became way oversold after the plunge to 130 and then firmed with a triangle consolidation last week (pink lines). There was a surge above 132 on Thursday and then another, and smaller, consolidation formed on Friday (blue lines). A move above 133 would break resistance and argue for a retracement of the prior decline. The middle target would be the 135.5-136 area, which is confirmed by broken supports and the 50% retracement. The low target would be 134, which is confirmed by the 38.2% retracement. A strong breakout should hold. Failure to hold the breakout at 133 and a move below 132 would put the bears back in the driver's seat. In the indicator window, RSI is flirting with the 50-60 resistance zone and a break above 60 would be short-term bullish.
**************************************************************************
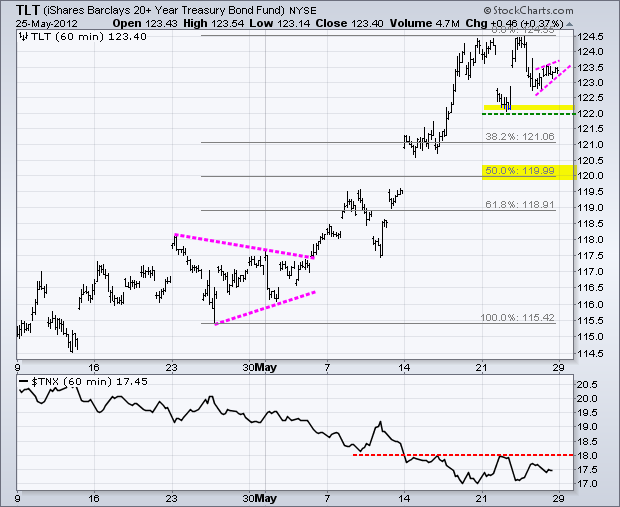
Treasuries will likely move counter to the stock market and the Euro. A surge in stocks would be positive and argue for a move lower. This, however, could be countered by relative weakness in the Euro, which may not surge today. We shall see. On the price chart, the 20+ Year T-Bond ETF (TLT) became as overbought as stocks were oversold. After consolidating in the 122-124.5 area, the ETF declined sharply on Thursday and then formed a small rising wedge. A break below wedge support would set up a support test at 122.
**************************************************************************
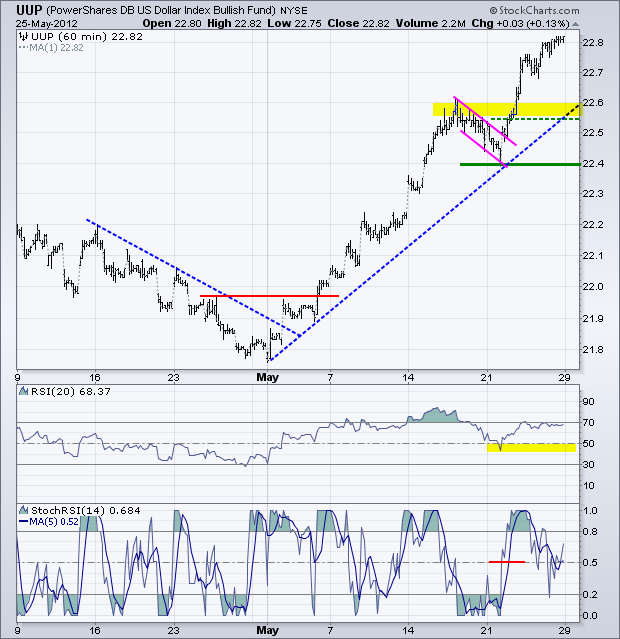
Events in Europe continue to drive the Dollar. Emphasis may shift from Europe to the US fiscal cliff, but timing such a sentiment shift is difficult and the politicians will not hit the fan until autumn. On the price chart, UUP remains overbought and in an uptrend. Broken resistance and the May trendline combine to mark first support in the 22.55-22.6 area. Key support is set at 22.4 and RSI support at 40.
**************************************************************************
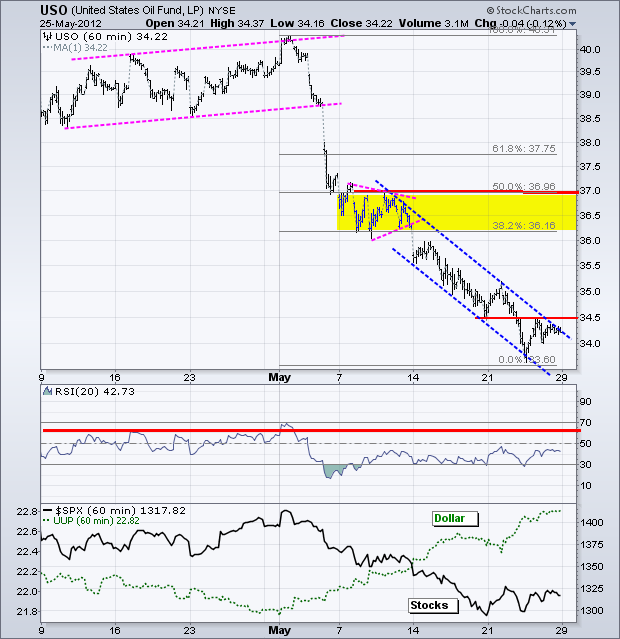
Oil will likely follow the stock market and the Euro. A move higher in stocks and the Euro would be positive for oil, which is way oversold. On the price chart, a tight falling channel formed the last two weeks and a move above 34.5 would break the first resistance level. This would argue for an oversold bounce, but I am not sure how high it will extend. A lot depends on stocks and the Dollar. The yellow zone marks the most obvious target with two key retracements and resistance from the pennant.
**************************************************************************
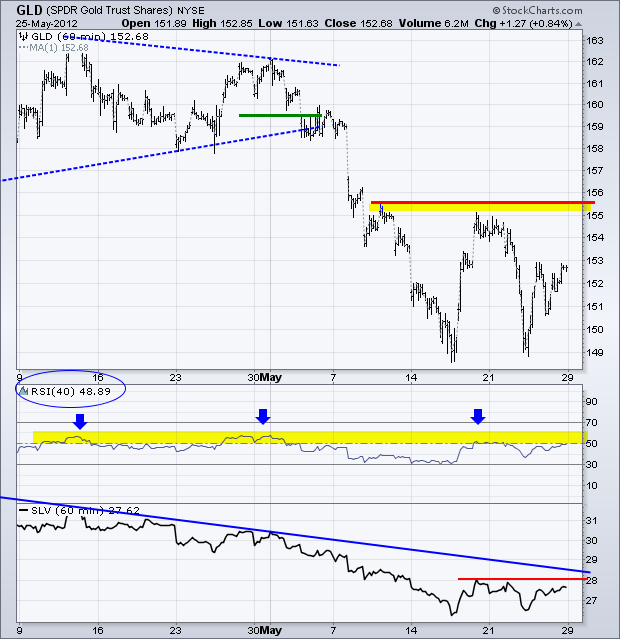
No change. The Gold SPDR (GLD) moved into a volatile consolidation zone the last two weeks with support around 149 and resistance around 155.50. The medium-term trend (daily chart) is clearly down and the short-term trend (60-minute chart) is also down because of the big support break in early May. Key resistance is set at 155.5 and a break above this level would be short-term bullish. This could also have medium-term consequences because support around 149 extends back to December. There is even a bottom picking play right now. Just make sure to use your stops.
**************************************************************************
Key Economic Reports:
Tue - May 29 - 09:00 - Case-Shiller Housing Index
Tue - May 29 - 10:00 - Consumer Confidence
Wed - May 30 - 07:00 - MBA Mortgage Index
Wed - May 30 - 10:00 - Pending Home Sales
Thu - May 31 - 07:30 - Challenger Job Cut Report
Thu - May 31 - 08:15 - ADP Employment Report
Thu - May 31 - 08:30 - Jobless Claims
Thu - May 31 - 08:30 - GDP
Thu - May 31 - 09:45 - Chicago PMI
Thu - May 31 - 11:00 - Oil Inventories
Fri - Jun 01 - 08:30 - Employment Report
Fri - Jun 01 - 10:00 - ISM Manufacturing Index
Fri - Jun 01 - 10:00 - Construction Spending
Fri - Jun 01 - 14:00 - Auto/Truck Sales
Sun - Jun 04 - 10:00 – Greek Holiday
Sun - Jun 17 - 10:00 – Greek Elections
Sun - Jun 28 - 10:00 – 2-day EU Summit
Charts of Interest: Tuesday and Thursday
This commentary and charts-of-interest are designed to stimulate thinking. This analysis is not a recommendation to buy, sell, hold or sell short any security (stock ETF or otherwise). We all need to think for ourselves when it comes to trading our own accounts. First, it is the only way to really learn. Second, we are the only ones responsible for our decisions. Think of these charts as food for further analysis. Before making a trade, it is important to have a plan. Plan the trade and trade the plan. Among other things, this includes setting a trigger level, a target area and a stop-loss level. It is also important to plan for three possible price movements: advance, decline or sideways. Have a plan for all three scenarios BEFORE making the trade. Consider possible holding times. And finally, look at overall market conditions and sector/industry performance.

About the author:
Arthur Hill, CMT, is the Chief Technical Strategist at TrendInvestorPro.com. Focusing predominantly on US equities and ETFs, his systematic approach of identifying trend, finding signals within the trend, and setting key price levels has made him an esteemed market technician. Arthur has written articles for numerous financial publications including Barrons and Stocks & Commodities Magazine. In addition to his Chartered Market Technician (CMT) designation, he holds an MBA from the Cass Business School at City University in London.
Learn More
