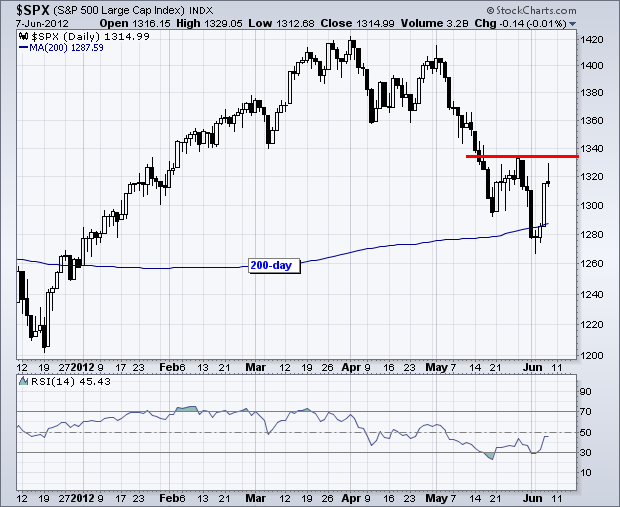
Stocks asked for stimulus and failed to get what they wanted. The EU has yet to come forth with a concrete plan for EU banks, Bernanke did not offer hints of quantitative easing and the ECB stands ready to act. Allez, act already! Bernanke said the Fed would ease if growth slowed. The stock market is signaling slower growth after its May decline and the treasury market is pricing in further easing as the 10-year Treasury Yield ($TNX) trades at multi-year lows. Bernanke is probably betting that this slow down is similar to last summer and economic growth will pick up again in the next few months. This could indeed be the case, but we need to see stocks and the 10-year treasury yield move above their late May highs for confirmation.
On the 60-minute chart, the S&P 500 ETF (SPY) extended its gains early Thursday, but got cold feet near resistance and fell in the final hour of trading. Even though the gap and breakout at 131 are holding, the bigger trends remain down and it looks like these bigger forces are making a statement. Chartists need to use 10 or 15 minute charts to set the four day uptrend and define support. I drew a trendline extending up from Monday's low and this trendline marks support at 131. Also notice that the 5-day EMA of StochRSI became overbought and is on the verge of breaking back below .50. The momentum cup is half empty when StochRSI moves into the bottom half of its range.


**************************************************************************
If stocks are backing off resistance, it must mean the 20+ Year T-Bond ETF (TLT) is bouncing off support. These two move in opposite directions, which means a decline in stocks would be bullish for treasuries. TLT decline to support in the 124 area and firmed. A move above 125.5 would produce a little breakout and this would be negative for stocks.

**************************************************************************
The US Dollar Fund (UUP) fell back as the stock market bounced the last four days. This still looks like a correction within a bigger uptrend. The trick, as always, is timing the end of the correction. UUP got a little bounce late Thursday to reinforce support in the 22.60 area. The 5-day EMA of StochRSI also turned up and a break above .50 would be the first positive sign. The pink lines show a Raff Regression Channel marking resistance at 22.86.

**************************************************************************
The US Oil Fund (USO) bounced back to the upper trendline of the falling channel and fell back in the final hour. USO broke rising flag support and this signals a continuation lower. Also note that commodities are getting hit hard in early trading on Friday. I will now mark short-term resistance at 33.

**************************************************************************
After acting strange on Wednesday, the Gold SPDR (GLD) plunged below first support at 156 on Thursday and tested support at 153. Half of this surge has failed and the other half is likely to fail if GLD breaks 153. Thursday's sharp decline is being blamed on Bernanke and his failure to offer more stimulus. Gold surged after Friday's weak jobs number because this provided the rational for further stimulus. Gold did not get what it wanted on Thursday and took back most of its gains.

**************************************************************************
Key Economic Reports:
Mon - Jun 11 - 10:00 – IMF Report on Spanish Banks
Sun - Jun 17 - 10:00 – Greek Elections
Sun - Jun 28 - 10:00 – 2-day EU Summit
Charts of Interest: Tuesday and Thursday
This commentary and charts-of-interest are designed to stimulate thinking. This analysis is not a recommendation to buy, sell, hold or sell short any security (stock ETF or otherwise). We all need to think for ourselves when it comes to trading our own accounts. First, it is the only way to really learn. Second, we are the only ones responsible for our decisions. Think of these charts as food for further analysis. Before making a trade, it is important to have a plan. Plan the trade and trade the plan. Among other things, this includes setting a trigger level, a target area and a stop-loss level. It is also important to plan for three possible price movements: advance, decline or sideways. Have a plan for all three scenarios BEFORE making the trade. Consider possible holding times. And finally, look at overall market conditions and sector/industry performance.


