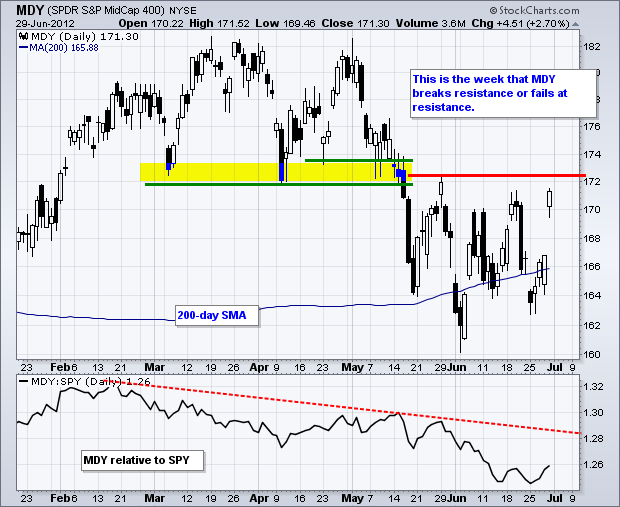
This broken week could be pivotal for the markets. The week is short with a July 4th break on Wednesday. Despite the shortened week, there are several key economic reports and the big employment report is Friday. The European induced surge is positive from a technical standpoint, but we need to see follow through this week with some better-than-expected economic reports. After Friday's big move, the market has priced in some pretty rosy expectations. Keep in mind that the majority of economic reports have been worse-than-expected the last three months. This worse-than-expected trend needs to change if follow through is in the cards.
On the 60-minute chart, the S&P 500 ETF (SPY) broke support with a gap down on Thursday morning, but filled this gap with a late surge above 132.50 in the final hour. Sometimes a failed signal is just as important as a signal. The bulls followed up on Friday morning by producing a big gap higher and resistance break at 134. Not only did Friday's gap hold, but SPY also moved higher after the gap. The gap zone and broken resistance turn into the first support zone in the 133.5-134 area. RSI confirmed the breakout with a move above 60 and momentum is also bullish. The 40-50 zone now becomes support.


**************************************************************************
The 20+ Year T-Bond ETF (TLT) failed at resistance and broke first support at 126 with a sharp move lower. While this is short-term negative, TLT is still within a bigger trading range and has yet to break key support at 124. This support level is key because it held through June. Moreover, a break would further the risk-on trade and this would boost stocks. This is the make-or-break week because we have a slew of economic reports with the employment report slated for Friday.

**************************************************************************
News out of Europe sent the Euro sharply higher and the Dollar sharply lower. The US Dollar Fund (UUP) formed a lower high and broke below support with a sharp move on the open. The ETF firmed after the open and may find support in the 22.40 area from the prior troughs. The decisions out of the EU summit may be positive, but implementation is a whole other ballgame that will take at least six months. The devil is most definitely in the details and the markets may quickly realize that promises are not the same as actions.

**************************************************************************
The US Oil Fund (USO) surged with its biggest move since April 2009. It looks like a massive short-covering rally triggered by positive news out of Europe, a fall in the Dollar and a surge in global equities. The news out of Europe may have prevented an economic meltdown, but it is not enough to spark strong economic growth. Oil needs strong growth and increased demand to sustain its advance. On the price chart, USO broke first resistance at 30.50 and hit key resistance at 32. With the ETF already overbought, it is prudent to let the dust settle and some sort of bullish continuation pattern unfold (pennant, wedge, flag).

**************************************************************************
Gold surged along with the other risk assets (Euro, stocks, oil). The Gold SPDR (GLD) held above its late May low and broke falling wedge resistance. This breakout is bullish until proven otherwise. Broken resistance in the 153 area turns into first support. Again, a strong breakout should hold and a move below this level would be considered a failed signal. RSI surged, but did not break 60 just yet. Also note that the Silver Trust (SLV) did not break resistance.

**************************************************************************
Key Reports and Events:
Mon - Jul 02 - 10:00 - ISM Index
Mon - Jul 02 - 10:00 - Construction Spending
Tue - Jul 03 - 10:00 - Factory Orders
Tue - Jul 03 - 14:00 - Auto/Truck Sales
Thu - Jul 05 - 07:00 - MBA Mortgage Index
Thu - Jul 05 - 07:30 - Challenger Job Cuts
Thu - Jul 05 - 10:00 – European Central Bank Policy Statement
Thu - Jul 05 - 08:15 - ADP Employment
Thu - Jul 05 - 08:30 - Initial Claims
Thu - Jul 05 - 10:00 - ISM Services
Thu - Jul 05 - 11:00 - Oil Inventories
Fri - Jul 06 - 08:30 - Employment Report
Charts of Interest: Tuesday and Thursday
This commentary and charts-of-interest are designed to stimulate thinking. This analysis is not a recommendation to buy, sell, hold or sell short any security (stock ETF or otherwise). We all need to think for ourselves when it comes to trading our own accounts. First, it is the only way to really learn. Second, we are the only ones responsible for our decisions. Think of these charts as food for further analysis. Before making a trade, it is important to have a plan. Plan the trade and trade the plan. Among other things, this includes setting a trigger level, a target area and a stop-loss level. It is also important to plan for three possible price movements: advance, decline or sideways. Have a plan for all three scenarios BEFORE making the trade. Consider possible holding times. And finally, look at overall market conditions and sector/industry performance.

About the author:
Arthur Hill, CMT, is the Chief Technical Strategist at TrendInvestorPro.com. Focusing predominantly on US equities and ETFs, his systematic approach of identifying trend, finding signals within the trend, and setting key price levels has made him an esteemed market technician. Arthur has written articles for numerous financial publications including Barrons and Stocks & Commodities Magazine. In addition to his Chartered Market Technician (CMT) designation, he holds an MBA from the Cass Business School at City University in London.
Learn More
