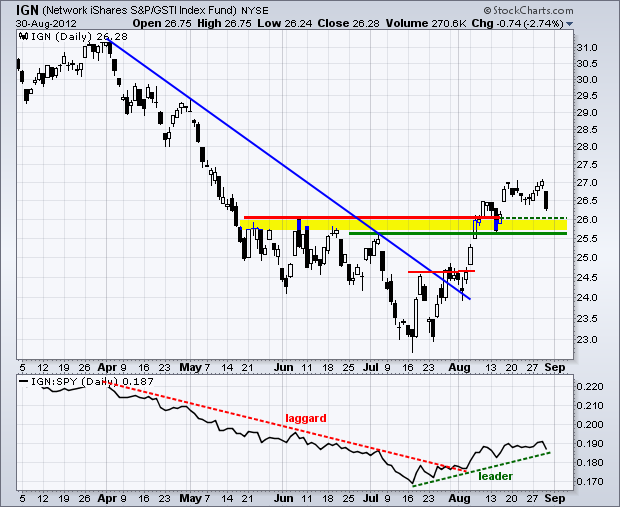
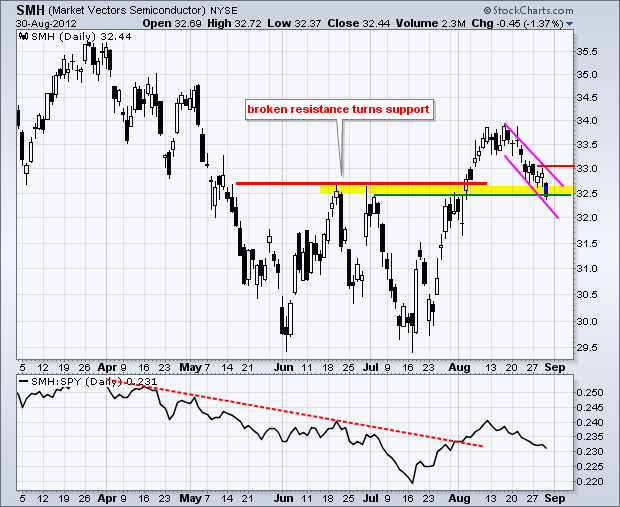
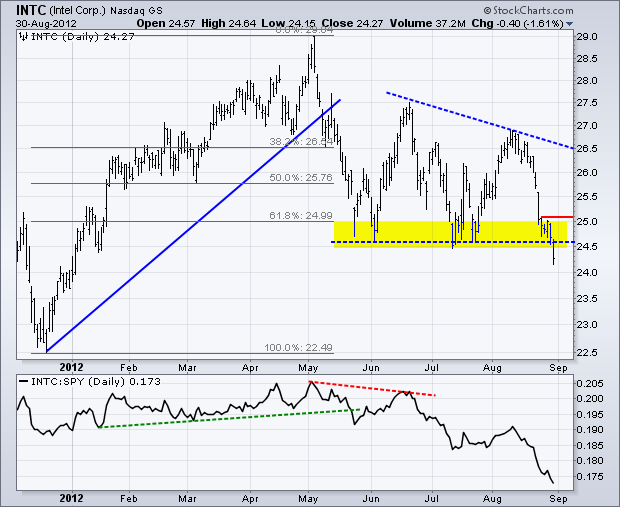
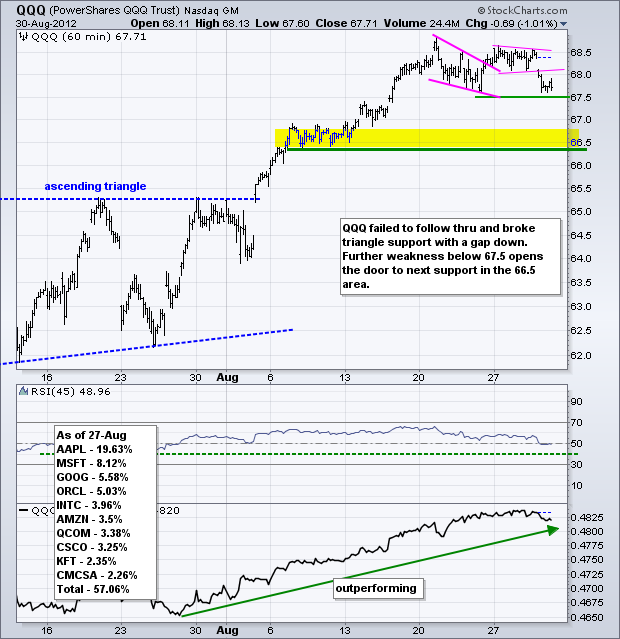
Stocks pulled back as traders moved aside ahead of Fed Chairman Bernanke's speech at Jackson Hole this morning. Truth be told, I think the three economic reports are more important that his speech, which will probably walk a fine line and repeat the last FOMC policy statement. Factory Orders, Michigan Sentiment and Chicago PMI are all on deck this morning. The major index ETFs moved lower on Thursday with modest declines across the board. All nine sectors were down with the Technology SPDR (XLK) leading the way (-1.11%). Weakness in the Networking iShares (IGN) and Market Vectors Semiconductor ETF (SMH) knocked XLK. IGN is poised to test broken resistance in the 25.5-26 area. SMH is testing broken resistance with a flag-like decline the last 2-3 weeks. Note that Intel (INTC) broke descending triangle support with a sharp decline on Thursday.

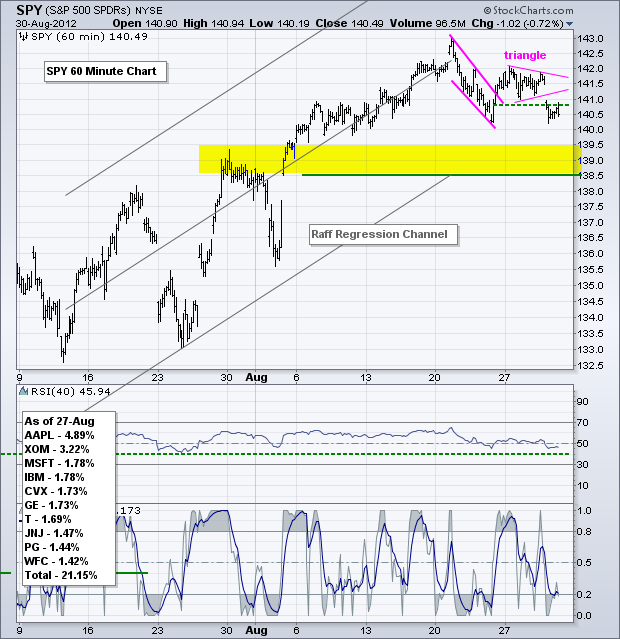
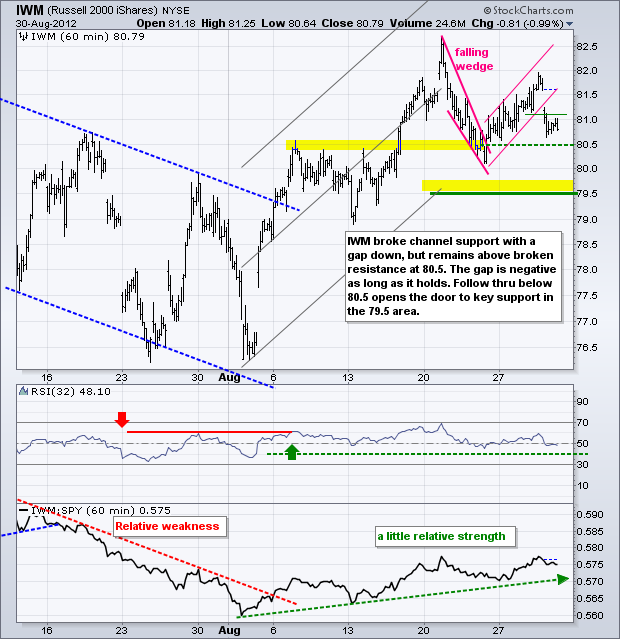
SPY, QQQ and IWM gapped down and stayed down. Even though they broke below first support, the medium-term trends are still up and the trend since late July is still up. In other words, this is still a correction within an uptrend. The end of the lower channel line of the Raff Regression Channel marks key short-term support for all three. A break below these key support levels would reverse the short-term uptrend, which has been in place since late July.
**************************************************************************
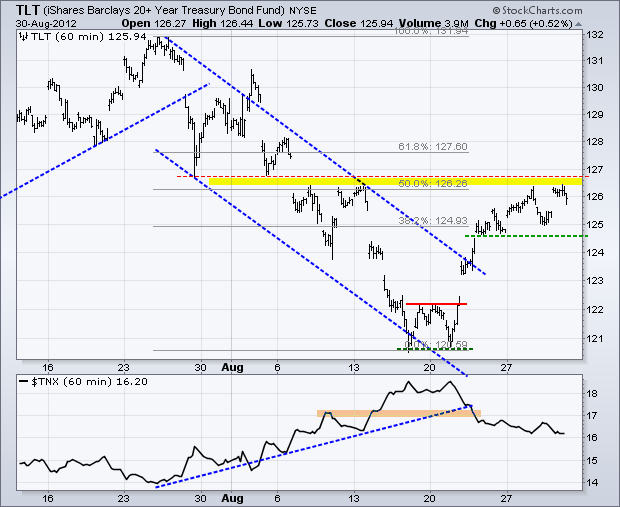
No change. Treasuries are going to have to give up their rally if stocks are to continue theirs. After becoming oversold near 121, the 20+ Year T-Bond ETF (TLT) surged above channel resistance and this breakout is holding. I am marking resistance in the 126.50 area. First support is set at 124.5 and a break below this level would suggest a move towards the risk-on trade.
**************************************************************************
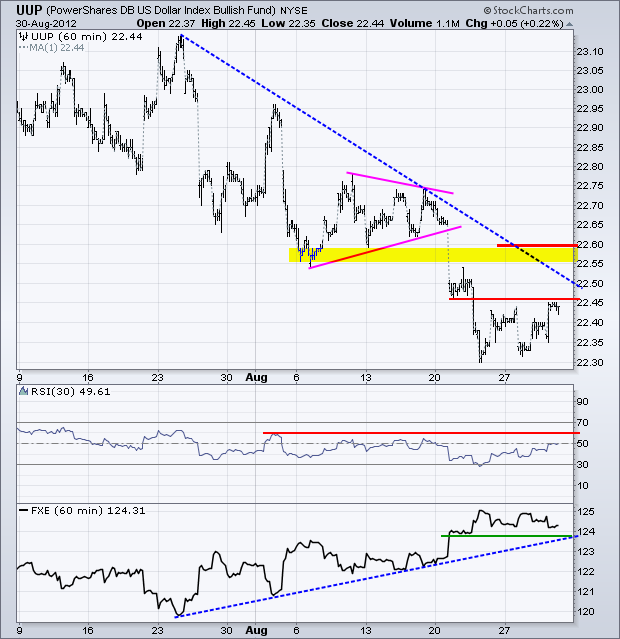
No change. The US Dollar Fund (UUP) is firming, but remains short of even a minor breakout. First resistance is set at 22.47 and key resistance at 22.60. Broken support and the late July trend line mark key resistance. RSI resistance is set at 60 and a break above this level is needed to turn momentum bullish. The US Dollar Index ($USD) is trading in a support zone (81-81.5) on the daily chart and a break above 82 would suggest a successful test.
**************************************************************************
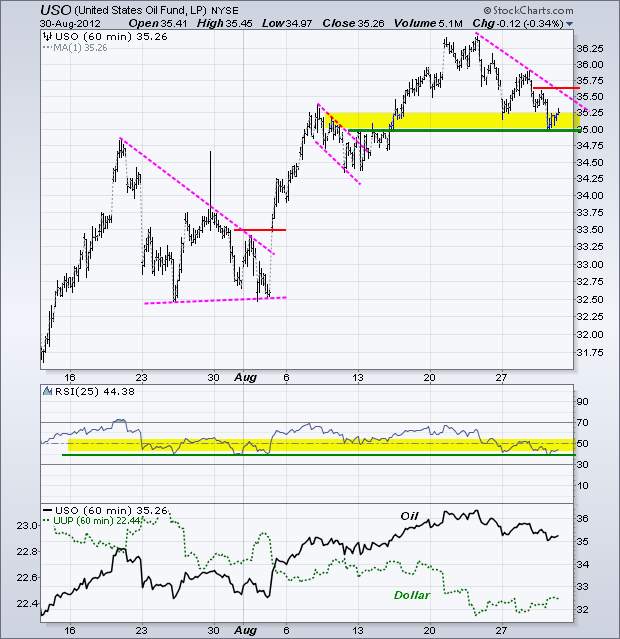
No change. The US Oil Fund (USO) broke above flag resistance, but did not get much help from the stock market or the Dollar. An upside surprise on inventories pushed prices lower on Wednesday. The flag breakout failed, but there is still support in the 35-35.25 area and RSI is trading in a support zone. A break below 35 in USO and 40 in RSI would be short-term bearish.
**************************************************************************
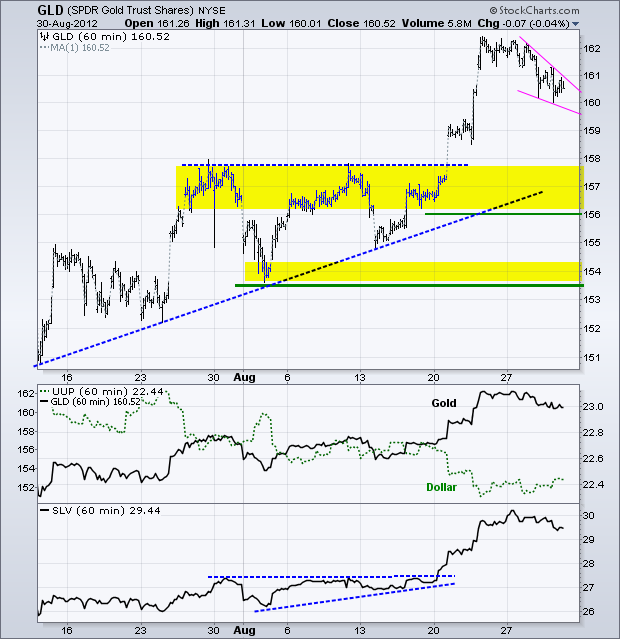
No change. The Gold SPDR (GLD) broke resistance with a big move on Tuesday and surged above 162. GLD is short-term overbought after a 4.5% surge in less than two weeks. Also note that weakness in the Dollar helped gold and a bounce in the Dollar could hurt. Broken resistance turns into the first support zone in the 156-158 area. Key support remains at 153.50.
**************************************************************************
Key Reports and Events:
Fri - Aug 31 - 09:45 - Chicago Purchasing Managers Index (PMI)
Fri - Aug 31 - 09:55 - Michigan Sentiment
Fri - Aug 31 - 10:00 - Factory Orders
Fri – Aug 31 – 10:00 – Bernanke Speaks from Jackson Hole
Thu – Sep 06 – 14:30 – European Central Bank (ECB) Meeting
Tue – Sep 11 – 09:00 – Troika to Greece
Wed – Sep 12 – 09:00 – German Constitutional Court Ruling
Wed – Sep 12 – 14:15 – FOMC Policy Statement
Sat – Oct 06 – 09:00 – EU Summit
Charts of Interest: Tuesday and Thursday
This commentary and charts-of-interest are designed to stimulate thinking. This analysis is not a recommendation to buy, sell, hold or sell short any security (stock ETF or otherwise). We all need to think for ourselves when it comes to trading our own accounts. First, it is the only way to really learn. Second, we are the only ones responsible for our decisions. Think of these charts as food for further analysis. Before making a trade, it is important to have a plan. Plan the trade and trade the plan. Among other things, this includes setting a trigger level, a target area and a stop-loss level. It is also important to plan for three possible price movements: advance, decline or sideways. Have a plan for all three scenarios BEFORE making the trade. Consider possible holding times. And finally, look at overall market conditions and sector/industry performance.

About the author:
Arthur Hill, CMT, is the Chief Technical Strategist at TrendInvestorPro.com. Focusing predominantly on US equities and ETFs, his systematic approach of identifying trend, finding signals within the trend, and setting key price levels has made him an esteemed market technician. Arthur has written articles for numerous financial publications including Barrons and Stocks & Commodities Magazine. In addition to his Chartered Market Technician (CMT) designation, he holds an MBA from the Cass Business School at City University in London.
Learn More