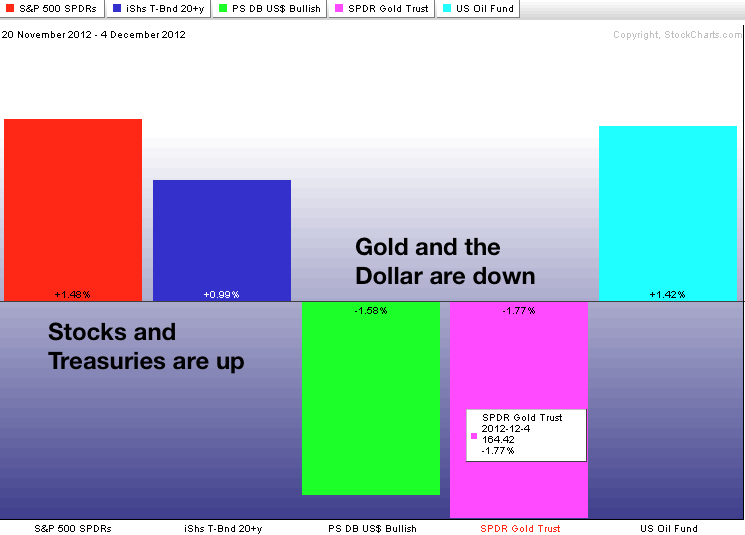
After a sharp advance the prior two weeks, stocks became short-term overbought and stalled the last two days. Resistance levels from prior consolidations and key retracements were also evident on the daily charts. Stocks looked ripe for at least a pullback, but downside has been limited this week. SPY is down .64% the last two days, the S&P MidCap 400 SPDR (MDY) is down .10% and the Russell 2000 ETF (IWM) is actually up .01%. Small-caps and mid-caps are holding strong and stocks refuse to buckle. Even though the ability to hold gains it positive, it is still a tricky situation. The Euro Currency Trust (FXE) is in a clear uptrend, which supports the risk-on trade and the stock market. Weakness in the Dollar could also be in response to the fiscal cliff deadlock. The 20+ Year T-Bond ETF (TLT), in contrast, is also up over the two weeks and this argues for the risk-off trade. Treasuries could be rallying at the prospects of going over the fiscal cliff. While going over the cliff would be negative for stocks, it would be bullish for treasuries because a cliff dive would trigger a recession and drastically improve the debt situation in the US. It is a tough call and the intermarket picture is very confused over the last two weeks. Note that the 20+ Year T-Bond ETF and the S&P 500 ETF are both up. These two are usually negatively correlated. Also note that the US Dollar Fund and the Gold SPDR are both down. These two are usually negatively correlated as well. Something is rotten in the intermarket kingdom.

No change. On the 60-minute chart, SPY closed above 142.5 in the first hour Monday and I extended the Raff Regression Channel to this new closing high. The lower trend line ends around 140 and I am adding a .50 point buffer to mark support at 139.50. A move below this level would clearly break the rising channel and signal a short-term trend reversal. Further up, I am marking minor support at 141 and a break below this level would provide the early signal that prices were rolling over. Note that the chances of increased volatility appear to be above average as we head into the employment report on Friday and fiscal cliff jawboning continues.


**************************************************************************
The 20+ Year T-Bond ETF (TLT) surged above Raff Regression Channel resistance to affirm support in the 123.5-124 area. Strength in treasuries is negative for stocks, but this is being offset by strength in the Euro. Treasuries will remain on the hot seat this week with ISM Services today and the employment report on Friday.

**************************************************************************
No change. The US Dollar Fund (UUP) seems to reflect the fiscal cliff realities more than the stock market. We have heard a lot of talk as both sides jockey for the upper hand in the negotiations, but the position differences remain large. It is a game of chicken and neither side will give in until the very last minute. UUP opened weak and remained weak on Monday and Tuesday. The downtrend continues with key resistance now marked at 22.

**************************************************************************
No change. The US Oil Fund (USO) surged to resistance, but fell back with the stock market and once again failed to break out. The swing within the trading range is up with the Raff Regression Channel marking support at 32.25. A break below this level would reverse the upswing and argue for a support test in the 31-31.25 area. A break below 31 would signal a continuation of the bigger downtrend.

**************************************************************************
No change. Even though the Dollar extended its downtrend and the stock market remains relatively strong, the Gold SPDR (GLD) broke down with a sharp decline below 167. This move broke rising wedge support to signal a continuation of the October decline. Overall, GLD has been in a trading range since October 2011 (148 – 175). Broken support turns resistance in the 167-168 area.

**************************************************************************
Key Reports and Events:
Wed - Dec 05 - 07:00 - MBA Mortgage Index
Wed - Dec 05 - 08:15 - ADP Employment Report
Wed - Dec 05 - 10:00 - Factory Orders
Wed - Dec 05 - 10:00 - ISM Services Index
Wed - Dec 05 - 10:30 - Oil Inventories
Thu - Dec 06 - 07:30 - Challenger Job Cuts
Thu - Dec 06 - 08:30 - Jobless Claims
Fri - Dec 07 - 08:30 - Employment Report
Fri - Dec 07 - 09:55 - Michigan Sentiment
Charts of Interest: Tuesday and Thursday
This commentary and charts-of-interest are designed to stimulate thinking. This analysis is not a recommendation to buy, sell, hold or sell short any security (stock ETF or otherwise). We all need to think for ourselves when it comes to trading our own accounts. First, it is the only way to really learn. Second, we are the only ones responsible for our decisions. Think of these charts as food for further analysis. Before making a trade, it is important to have a plan. Plan the trade and trade the plan. Among other things, this includes setting a trigger level, a target area and a stop-loss level. It is also important to plan for three possible price movements: advance, decline or sideways. Have a plan for all three scenarios BEFORE making the trade. Consider possible holding times. And finally, look at overall market conditions and sector/industry performance.

About the author:
Arthur Hill, CMT, is the Chief Technical Strategist at TrendInvestorPro.com. Focusing predominantly on US equities and ETFs, his systematic approach of identifying trend, finding signals within the trend, and setting key price levels has made him an esteemed market technician. Arthur has written articles for numerous financial publications including Barrons and Stocks & Commodities Magazine. In addition to his Chartered Market Technician (CMT) designation, he holds an MBA from the Cass Business School at City University in London.
Learn More