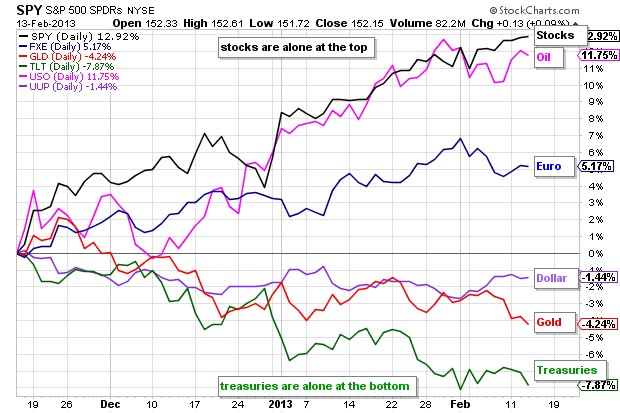
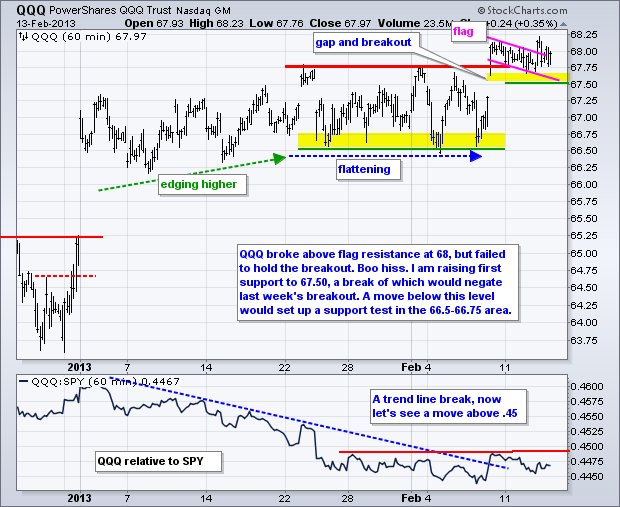
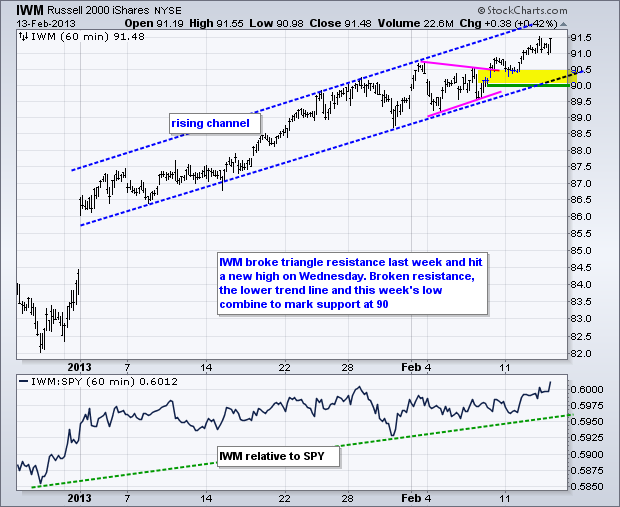
Guess what? Stocks were mixed again on Wednesday. The Dow Industrials SPDR (DIA) edged lower, while the S&P 500 ETF (SPY) and other major index ETFs edged higher. Once again, "edged" is the key word here because price movements were miniscule. Nevertheless, the Russell 2000 ETF (IWM) managed to close at another 52-week high and further extend overbought conditions. Stocks got some help from Treasuries, which declined sharply on the day. Money moving out of safe-haven Treasuries continues to find its way into the stock market.
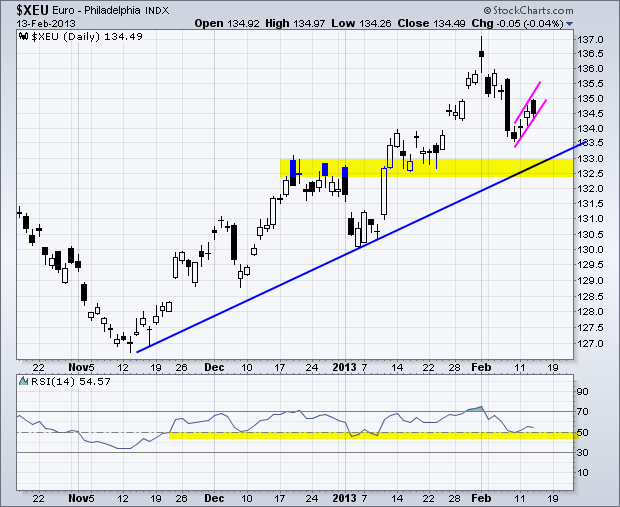
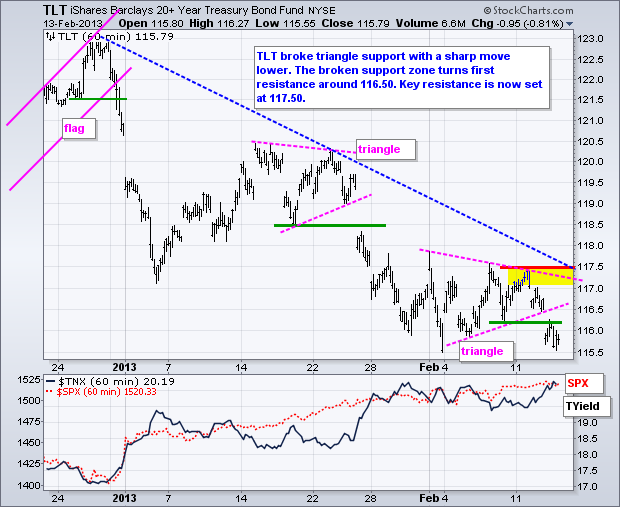
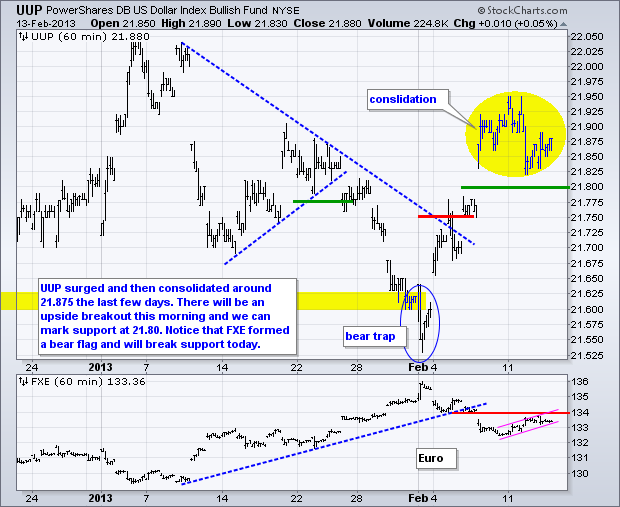
The sectors were mixed with three up, five down and one unchanged. There were some sizable moves within the industry group ETFs. The Networking iShares (IGN) and the Metals & Mining SPDR (XME) fell over 1%, while the Airline ETF (FAA) and the Solar Energy ETF (TAN) advanced over 1%. Oil related stocks were also fairly strong as Spot Light Crude ($WTIC) challenged the $97 area. Stocks will get a test today because the Euro is down sharply this morning. Bloomberg reports: "the euro-area recession deepened more than economists forecast with the worst performance in almost four years as its three biggest economies suffered slumping output". Further strength in the Dollar would be negative for commodities, and possibly stocks. Watch Treasuries for clues on stocks. An upside breakout in the 20+ Year T-Bond ETF (TLT) would suggest that the long-overdue stock market correction is at hand.
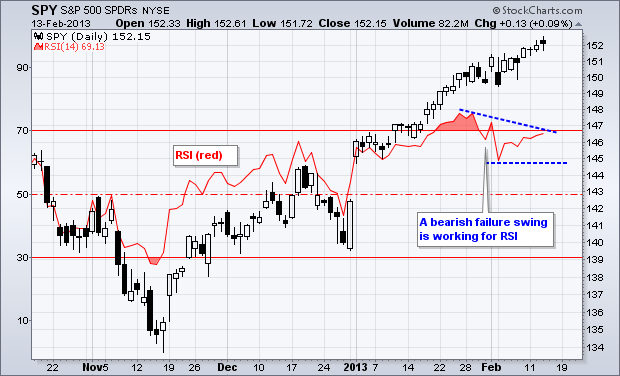
The chart below shows SPY with a bearish failure swing working in RSI. According to Wilder, creator of RSI, a bearish failure swing occurs when RSI moves above 70, declines below 70 and then fails to exceed 70 on the next bounce. Also notice that SPY moved to a new high and RSI has yet to make it back above 70. The bearish failure swing would be confirmed should RSI break below its prior low (early February).
**************************************************************************
**************************************************************************
**************************************************************************
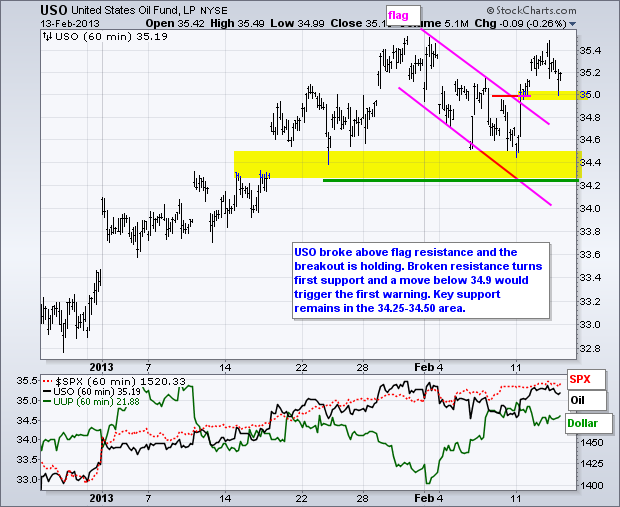
**************************************************************************
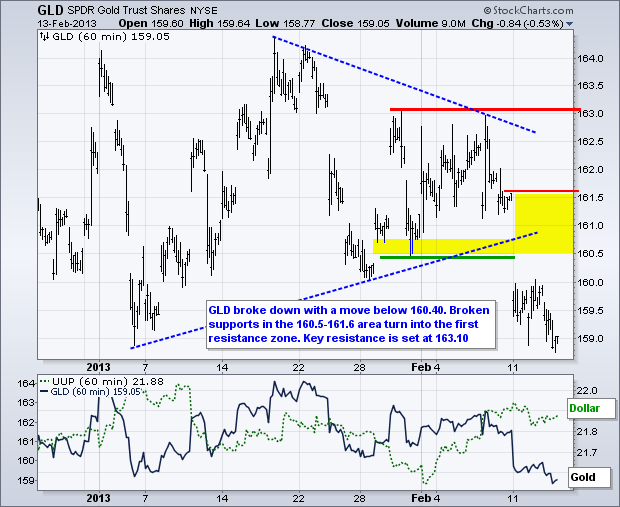
**************************************************************************
Key Reports and Events:
Thu - Feb 14 - 08:30 - Jobless Claims
Thu - Feb 14 - 10:30 - Natural Gas Inventories
Fri - Feb 15 - 08:30 – Empire State Manufacturing
Fri - Feb 15 - 09:15 - Industrial Production/Utilization
Fri - Feb 15 - 09:55 - Michigan Sentiment
Sun - Feb 24 - 10:00 – Italian Parliamentary Elections
Fri – Mar 01 - 23:59 – Sequester Takes Effect (unless...)
Wed – Mar 27 - 23:59 – Government Shut Down Deadline
Wed – May 15 - 23:59 – New Debt Ceiling Deadline
Charts of Interest: Tuesday and Thursday
This commentary and charts-of-interest are designed to stimulate thinking. This analysis is
not a recommendation to buy, sell, hold or sell short any security (stock ETF or otherwise).
We all need to think for ourselves when it comes to trading our own accounts. First, it is
the only way to really learn. Second, we are the only ones responsible for our decisions.
Think of these charts as food for further analysis. Before making a trade, it is important
to have a plan. Plan the trade and trade the plan. Among other things, this includes setting
a trigger level, a target area and a stop-loss level. It is also important to plan for three
possible price movements: advance, decline or sideways. Have a plan for all three scenarios
BEFORE making the trade. Consider possible holding times. And finally, look at overall market
conditions and sector/industry performance.

About the author:
Arthur Hill, CMT, is the Chief Technical Strategist at TrendInvestorPro.com. Focusing predominantly on US equities and ETFs, his systematic approach of identifying trend, finding signals within the trend, and setting key price levels has made him an esteemed market technician. Arthur has written articles for numerous financial publications including Barrons and Stocks & Commodities Magazine. In addition to his Chartered Market Technician (CMT) designation, he holds an MBA from the Cass Business School at City University in London.
Learn More
