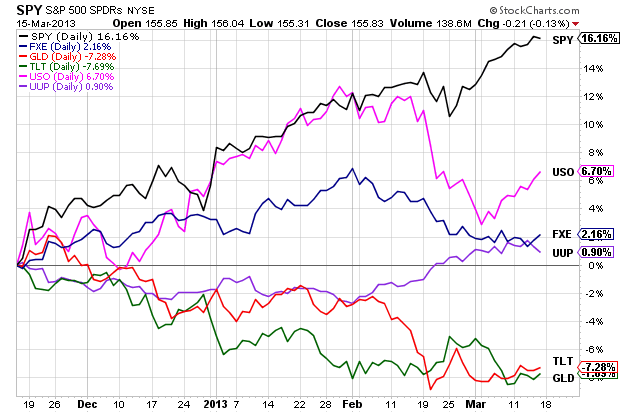
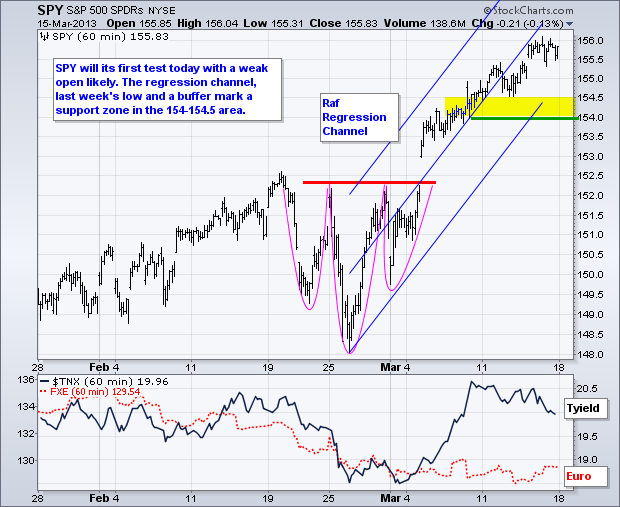
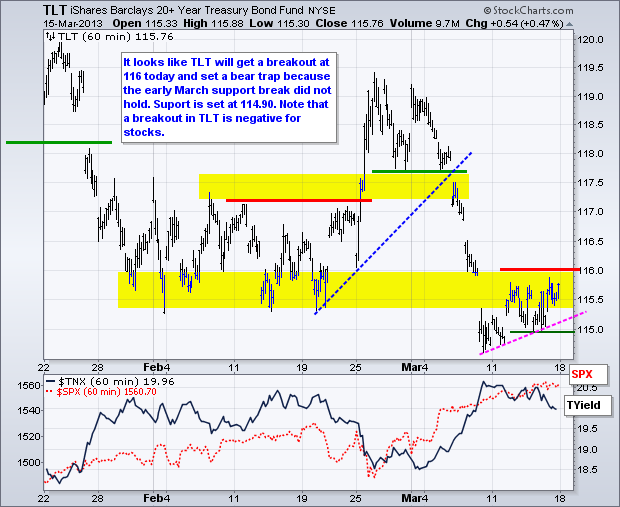
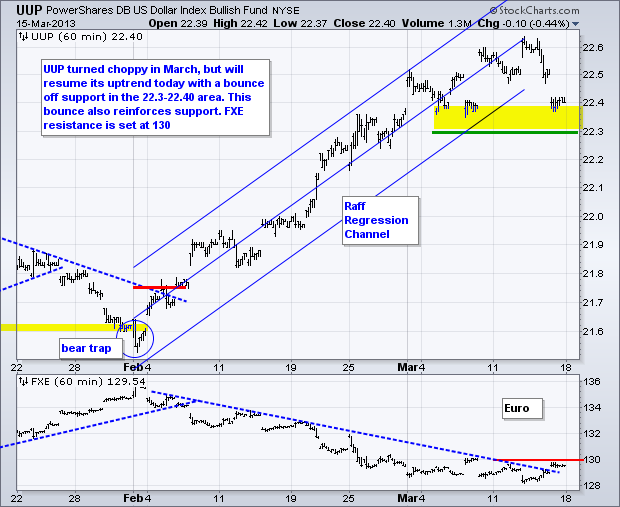
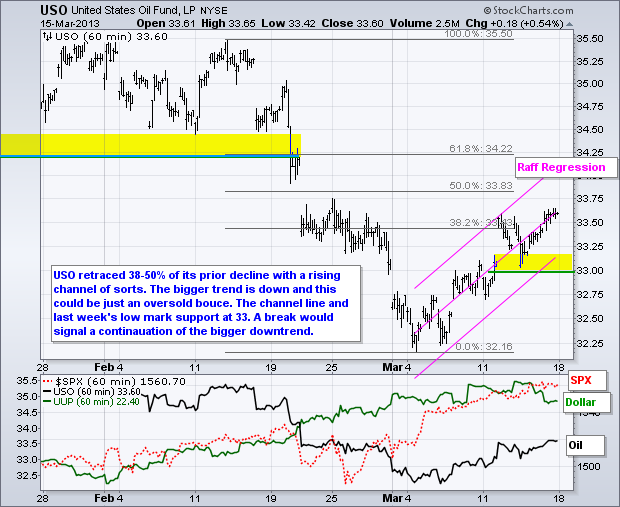
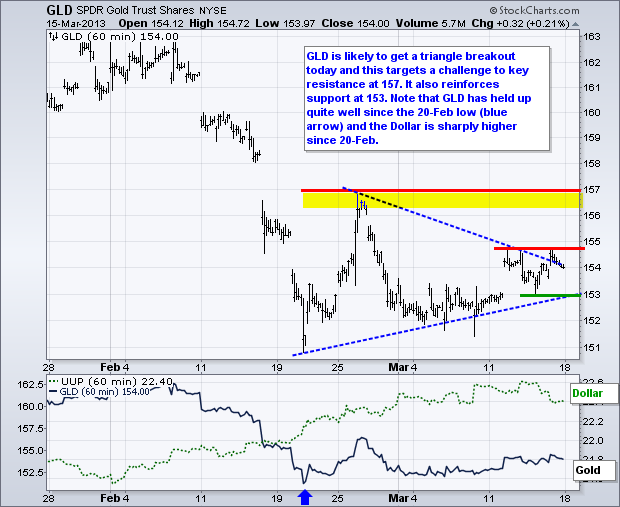
Look out below. Cyprus is getting the blame for today's move to risk-off. In short, the unprecedented decision to tax bank deposits in an EU country is putting the scare into markets. Cyprus is tiny, but the ramifications are being felt across the world today. Asian and European markets are down 1-2%. The Euro is sharply lower, the Dollar is sharply higher and gold is getting a small bounce. Oil is getting stung by a surging Dollar and following stock market. Treasuries are benefitting from a flight to safety. Stocks were overbought in mid March and ripe for a correction anyway. It is unclear if this will be a short 1-3 day correction or a multi-week correction. The Dollar was already in a medium-term uptrend and will continue this uptrend. Meanwhile, oil was in a medium-term downtrend and would signal a continuation with a short-term support break. Treasuries are in a medium-term downtrend, but could get a short-term breakout today that would argue for an oversold bounce that would weigh on stocks. Gold is the wild card here. Even though the Dollar is up sharply since February 20th, gold is unchanged and holding firm. A triangle breakout could trigger today.

**************************************************************************
**************************************************************************
**************************************************************************
**************************************************************************
**************************************************************************
Key Reports and Events (all times Eastern):
Mon - Mar 18 - 10:00 - NAHB Housing Market Index
Tue - Mar 19 - 08:30 - Housing Starts/Building Permits
Wed - Mar 20 - 07:00 - MBA Mortgage Index
Wed - Mar 20 - 10:30 - Oil Inventories
Wed - Mar 20 - 14:00 - FOMC Rate Decision
Thu - Mar 21 - 08:30 - Jobless Claims
Thu - Mar 21 - 10:00 - Existing Home Sales
Thu - Mar 21 - 10:00 - Philadelphia Fed
Thu - Mar 21 - 10:00 - Leading Indicators
Thu - Mar 21 - 10:30 - Natural Gas Inventories
Wed – Mar 27 - 23:59 – US Government Shut Down Deadline
Wed – May 15 - 23:59 – US Debt Ceiling Deadline
Charts of Interest: Tuesday and Thursday
This commentary and charts-of-interest are designed to stimulate thinking. This analysis is
not a recommendation to buy, sell, hold or sell short any security (stock ETF or otherwise).
We all need to think for ourselves when it comes to trading our own accounts. First, it is
the only way to really learn. Second, we are the only ones responsible for our decisions.
Think of these charts as food for further analysis. Before making a trade, it is important
to have a plan. Plan the trade and trade the plan. Among other things, this includes setting
a trigger level, a target area and a stop-loss level. It is also important to plan for three
possible price movements: advance, decline or sideways. Have a plan for all three scenarios
BEFORE making the trade. Consider possible holding times. And finally, look at overall market
conditions and sector/industry performance.

About the author:
Arthur Hill, CMT, is the Chief Technical Strategist at TrendInvestorPro.com. Focusing predominantly on US equities and ETFs, his systematic approach of identifying trend, finding signals within the trend, and setting key price levels has made him an esteemed market technician. Arthur has written articles for numerous financial publications including Barrons and Stocks & Commodities Magazine. In addition to his Chartered Market Technician (CMT) designation, he holds an MBA from the Cass Business School at City University in London.
Learn More