Art's Charts February 28, 2014 at 04:07 AM
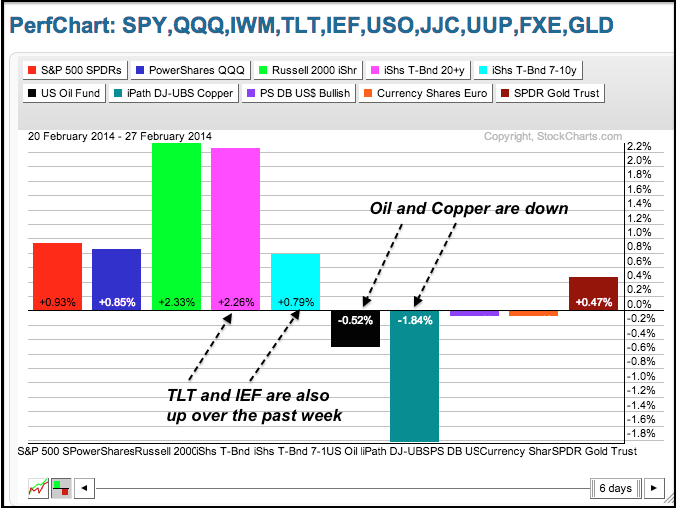
Buying pressure continues to outpace selling pressure as the major index ETFs moved higher on Thursday. The Russell MicroCap iShares (IWC) led the way with a .88% gain. The Russell 2000 ETF (IWM) is leading the major index ETFs with a 2.33% gain over the past week... Read More
Art's Charts February 27, 2014 at 06:33 AM
AOL Firms at Support. FDX Extends Flag. Plus JDSU, PAYX, UPS Individual charts are below video. Sorry but your browser doesn't support HTML5 video... Read More
Art's Charts February 27, 2014 at 05:07 AM
Stocks continued their meandering ways with the Nasdaq 100 ETF (QQQ) edging lower and the Russell 2000 ETF (IWM) edging higher. There were, however, some significant movers that support overall market strength. IWM hit a new high and led the market (small-caps)... Read More
Art's Charts February 26, 2014 at 04:18 AM
Stocks meandered on Tuesday with some buying interest in the morning and selling pressure in the afternoon. The major index ETFs finished mixed with the Russell 2000 ETF (IWM) edging higher (.10%) and the S&P 500 SPDR (SPY) closing fractionally lower (-.04%)... Read More
Art's Charts February 25, 2014 at 06:57 AM
Stocks started strong and remained strong most of the day, but selling pressure hit in the afternoon and stocks gave up some of their gains. The Russell 2000 ETF (IWM) led the way with a .73% gain and the Nasdaq 100 ETF (QQQ) advanced .64%... Read More
Art's Charts February 25, 2014 at 06:40 AM
BA Hits Moment of Truth. BZH Bounces off Key Retracement. Plus CYH, DSX, MED Individual charts are below video. Sorry but your browser doesn't support HTML5 video... Read More
Art's Charts February 24, 2014 at 05:13 AM
The major index ETFs dipped in the first half of the week and rebounded in the second half to extend their short-term uptrends... Read More
Art's Charts February 21, 2014 at 04:04 AM
Stocks pulled back for a day and then rebounded on Thursday with small-caps leading the way. All sectors were up, but the gains in three of the four offensive sectors were relatively muted. XLI led with a .94% gain, while XLK gained just .33%, XLY advanced .54% and XLF added ... Read More
Art's Charts February 20, 2014 at 06:29 AM
Stocks started the week in strong uptrends, but were overbought after big moves in the first half of February. The release of the FOMC Minutes provided the trigger for some profit taking as stocks turned south in the afternoon... Read More
Art's Charts February 20, 2014 at 06:25 AM
AMZN Underperforms with Pennant. BTU Bounces with Good Volume. Plus FDX, FIO, ITUB Individual charts are below video. Sorry but your browser doesn't support HTML5 video... Read More
Art's Charts February 19, 2014 at 06:00 AM
Directional changes seem to be more important than magnitude indicators these days. It is not the first time, nor will it be the last. The advance over the last two weeks started with a seemingly meek reversal... Read More
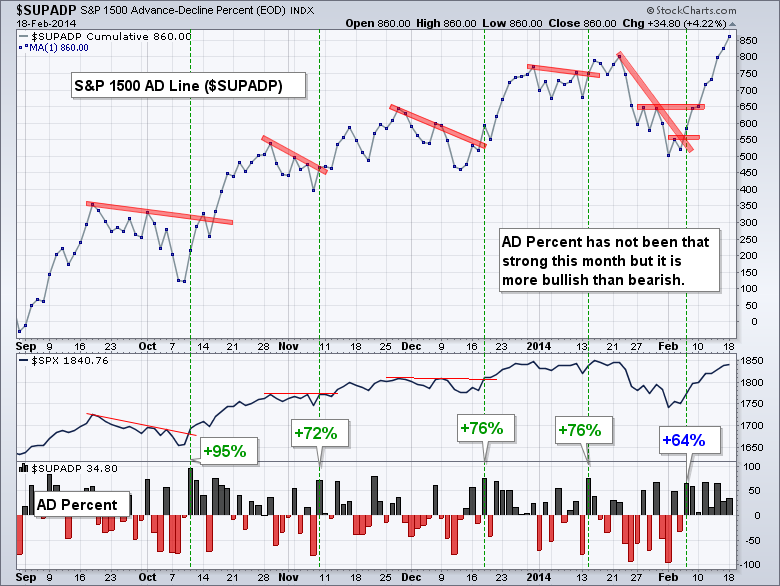
Art's Charts February 18, 2014 at 06:20 AM
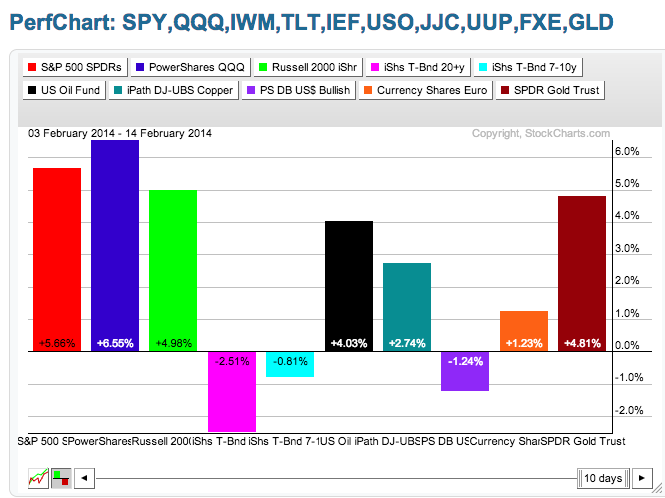
Stocks begin a four-day week in strong short-term uptrends that are quite extended. In just two weeks, SPY is up over 5.66%, QQQ is up 6.55% and IWM is up around 5%... Read More
Art's Charts February 18, 2014 at 06:14 AM
APOL Stalls after High Volume Decline. BAC Holds Flag Break. Plus GES, MDR, RRD Individual charts are below video. Sorry but your browser doesn't support HTML5 video... Read More
Art's Charts February 14, 2014 at 04:07 AM
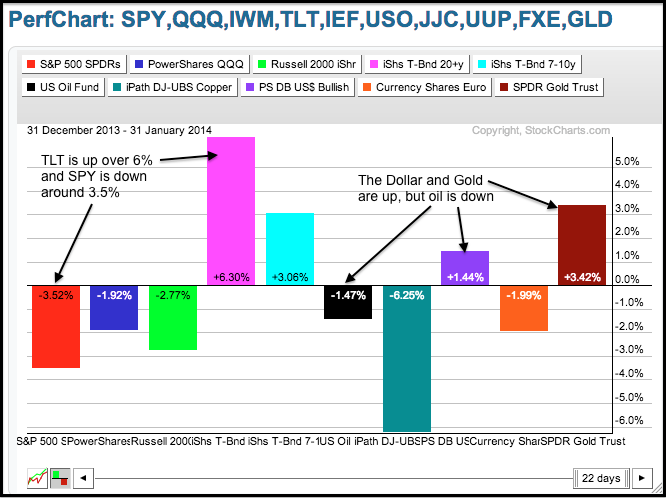
Stocks opened weak after a decline in retail sales, but soon caught a bid and closed strong. Buying pressure in the face of negative news is positive for the stock market. Also note that stocks advanced even as the 20+ YR T-Bond ETF (TLT) moved higher... Read More
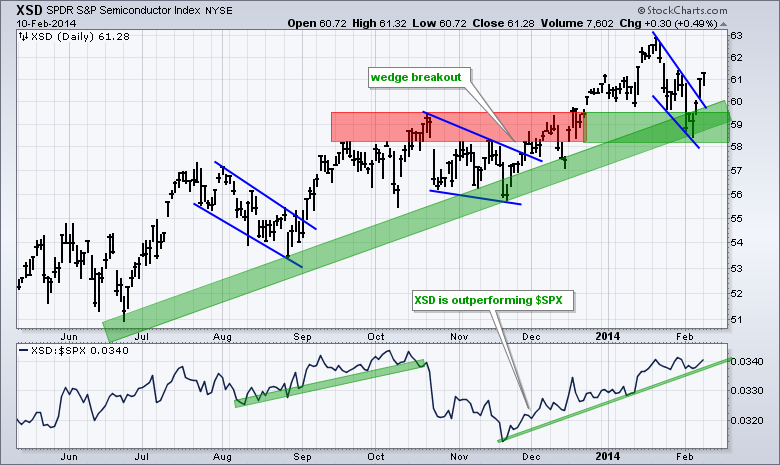
Art's Charts February 13, 2014 at 07:27 AM
Stocks turned a bit mixed on Wednesday. The Dow Diamonds (DIA) edged lower, while the Russell 2000 ETF (IWM) edged higher. The price movements in the sector SPDRs were quite small. Tech stocks were strong again as the Semiconductor SPDR (XSD) surged 1... Read More
Art's Charts February 13, 2014 at 07:22 AM
ARUN Tests the Breakout Zone. ASEI Forms Wedge near Key Retracement. Plus BOOM, EMKR, FNSR, JBHT, MS, S Individual charts are below video. Sorry but your browser doesn't support HTML5 video... Read More
Art's Charts February 12, 2014 at 04:28 AM
Stocks extended the rally with the major index ETFs gaining around 1%. The rally seemed big because the Dow gained almost 200 points, but it was actually modest in percentage terms. DIA did lead the way with a 1.27% advance. The Russell 2000 ETF (IWM) lagged again with a ... Read More
Art's Charts February 11, 2014 at 06:22 AM
Stocks extended their bounce with small gains in the major index ETFs on Monday. The Nasdaq 100 ETF (QQQ) led the way with a .57% gain and the S&P 500 SPDR (SPY) gained .18% on the day... Read More
Art's Charts February 11, 2014 at 06:17 AM
COST Holds the Gap FDX Breaks a Flag Line. Pus GERN, GS, JBL, X Individual charts are below video. Sorry but your browser doesn't support HTML5 video... Read More
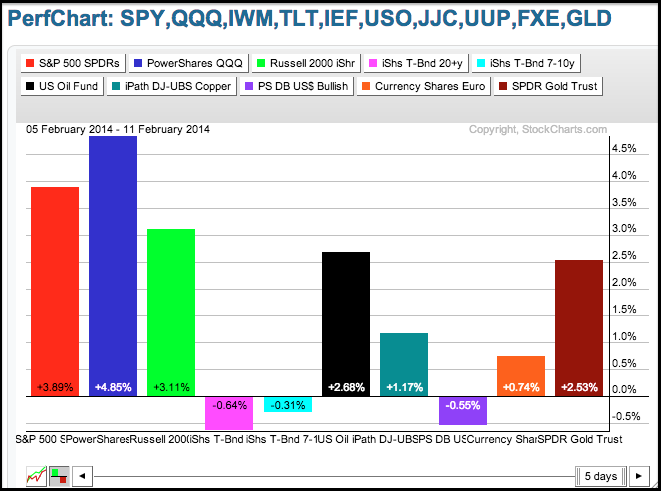
Art's Charts February 10, 2014 at 05:33 AM
Stocks rebounded at the end of the week with the S&P 500 SPDR (SPY) and Nasdaq 100 ETF (QQQ) posting modest gains (+.84% and +1.19%). The Russell 2000 ETF (IWM) and the Russell MicroCap iShares (IWC), however, posted weekly losses of 1.26% and 1.91%, respectively... Read More
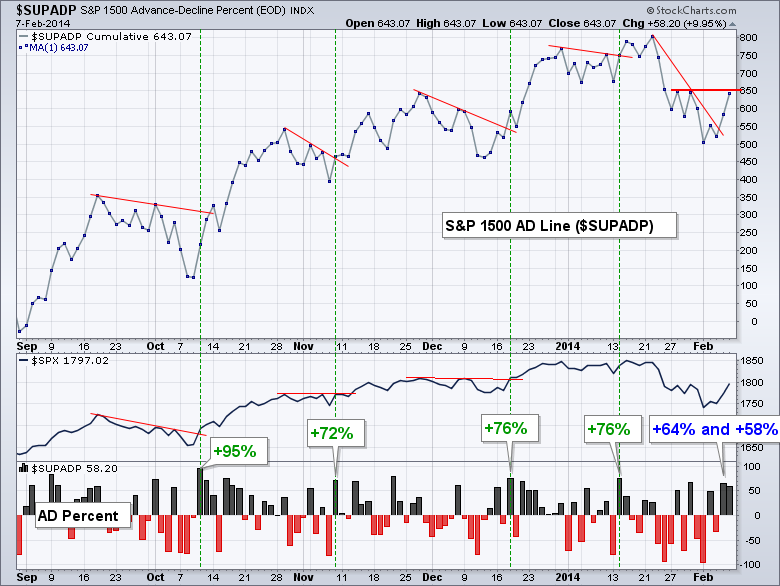
Art's Charts February 07, 2014 at 04:31 AM
Stocks got their oversold bounce with a decent advance, but small-caps lagged and breadth could have been stronger. SPY fell sharply on Monday and was down over 5% year-to-date at the time... Read More
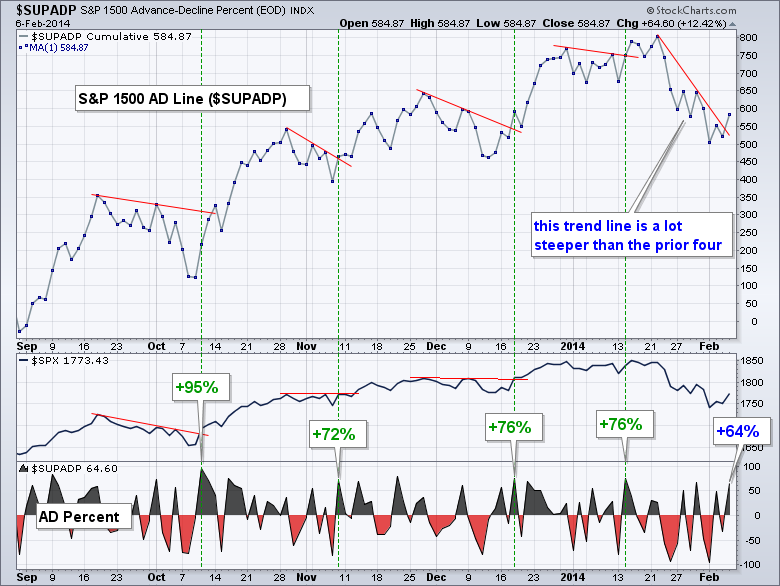
Art's Charts February 06, 2014 at 06:59 AM
Stocks remained under pressure with the Russell 2000 ETF (IWM) falling .75% and the S&P 500 SPDR (SPY) losing .12%. Selling pressure, however, was contained as the Dow Diamonds (DIA) ended the day with a small gain. The sectors were mixed with the Energy SPDR (XLE) falling ... Read More
Art's Charts February 06, 2014 at 06:54 AM
Three Stocks with a Selling Climax Plus Three Firming at Support Individual charts are below video. Sorry but your browser doesn't support HTML5 video... Read More
Art's Charts February 05, 2014 at 03:37 AM
Stocks got a small bounce on Tuesday with mid-caps leading the way higher. All sectors were higher with the Consumer Discretionary SPDR (XLY), Finance SPDR (XLF) and Energy SPDR (XLE) gaining over 1%. All three were beaten down pretty good and were ripe for some sort of bounce... Read More
Art's Charts February 04, 2014 at 07:01 AM
Sorry but your browser doesn't support HTML5 video. **This chart analysis is for educational purposes only, and should not be construed as a recommendation to buy, sell or sell-short said securities** This commentary and charts-of-interest are designed to stimulate thinking... Read More
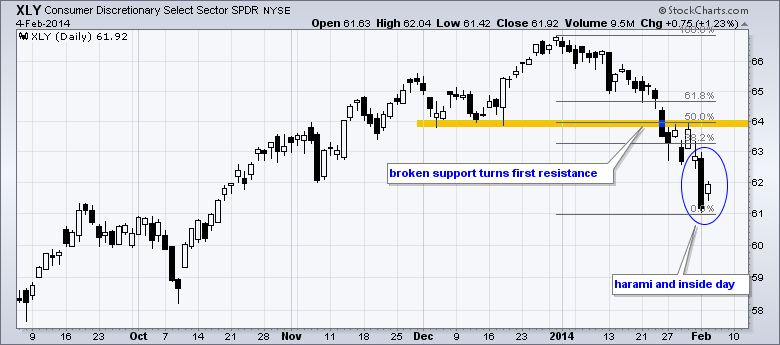
Art's Charts February 04, 2014 at 06:02 AM
Stocks got slammed as the perfect storm just got more perfect. The list of negatives continues to grow. Starting internally, stocks were ripe for a correction in mid January and the Consumer Discretionary SPDR (XLY) has underperformed the entire year... Read More
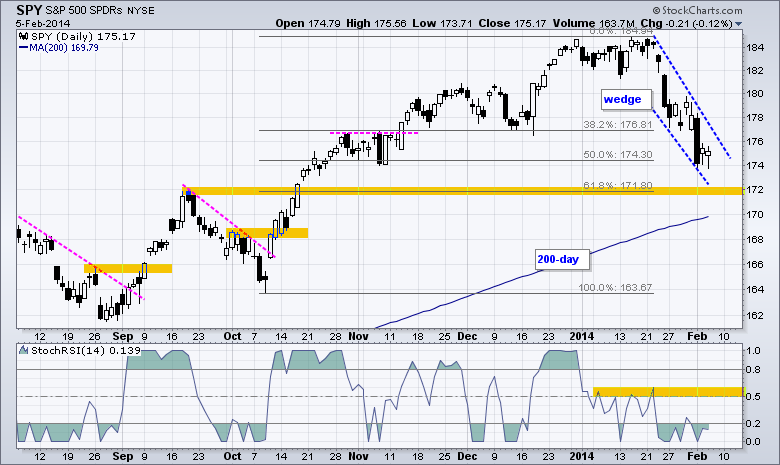
Art's Charts February 02, 2014 at 05:32 AM
After a big decline two weeks ago, stocks moved into a choppy consolidation last week. SPY produced three gaps two weeks ago and another three gaps last week. SPY gapped down from resistance on 23-Jan and gapped down again on 24-Jan en route to a sharp two-day decline... Read More