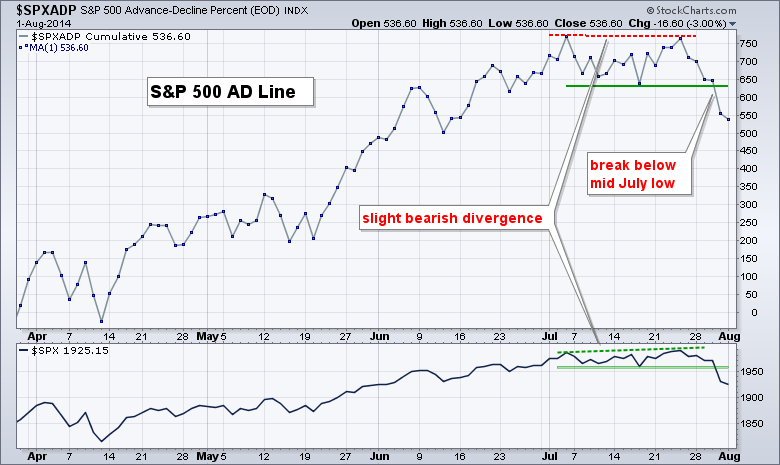
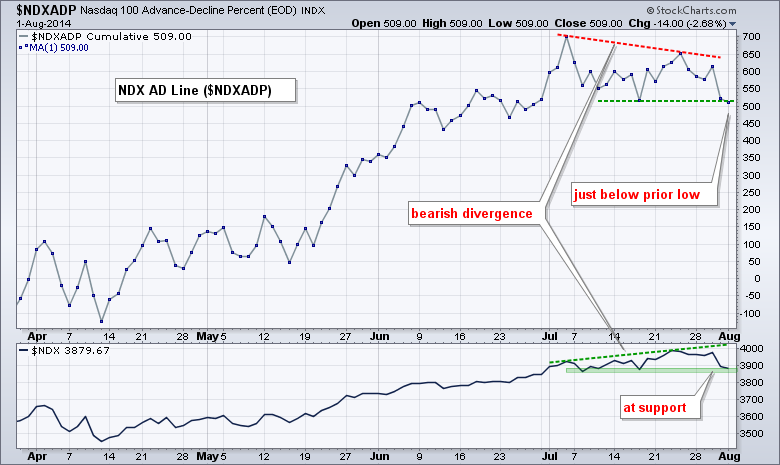
Stocks were hit with broad selling pressure last week. Small-caps were weak, but large-caps joined the party last week as both DIA and SPY broke below their July lows. DIA broke below its June lows as well and gave up its June-July gains in a hurry. The Industrials SPDR and Finance SPDR were hit hard and broke support from their July lows. The Regional Bank SPDR broke flag support as the 10-YR Treasury Yield edged higher. The Home Construction iShares moved below its May low and remains one of the weakest industry group ETFs. As noted in the Market Message on Friday, we could see more weakness in August because the seasonal tendencies are bearish. Over the last 20 years, the S&P 500 rose just 53% of the time in August and the average gain was a loss (-1.2%). It is also worth noting that the AD Lines for the S&P 500 and Nasdaq 100 broke below their July lows. This means two key breadth indicators are in short-term downtrends.
**This chart analysis is for educational purposes only, and should not
be construed as a recommendation to buy, sell or sell-short said securities**
**************************************************************
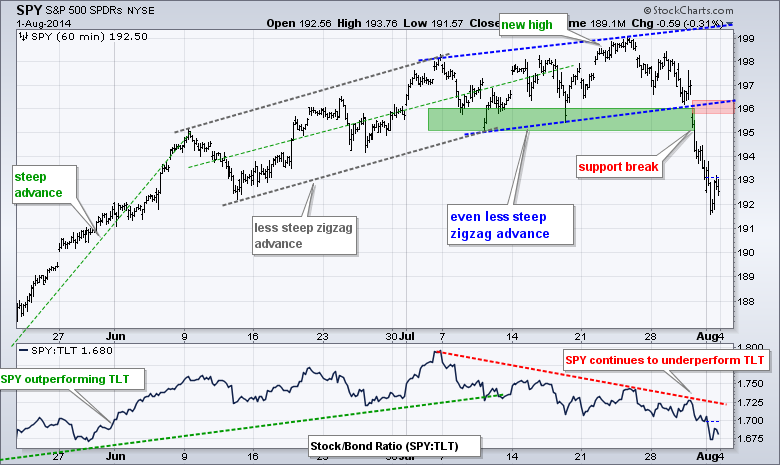
SPY broke channel support with a sharp decline and continued lower after the break. The ETF is now down around 3.5% from high to low (199 to 192) and short-term oversold. This means the mean reversion players using two to five period RSI are looking for a bounce. Broken support in the 196 area marks the first resistance zone.
**************************************************************
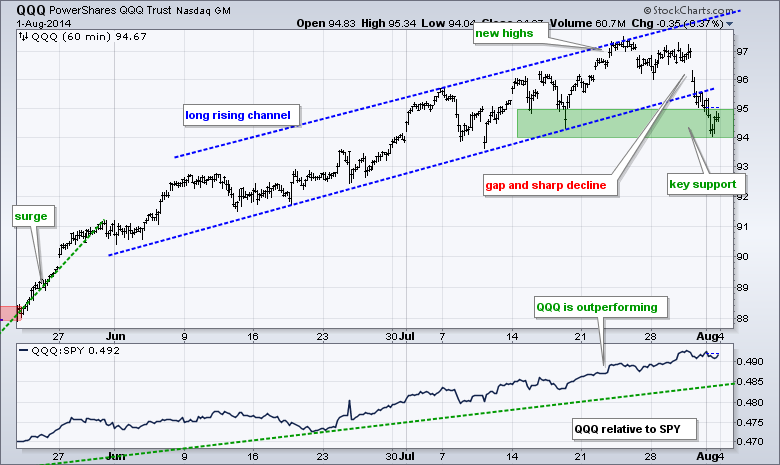
QQQ gapped down and broke the lower trend line of the rising channel. Note that the gap and trend line break held. As with SPY, QQQ is getting short-term oversold after a sharp decline in a few days. Unlike SPY, chartists can still make the case for a short-term uptrend because there is still support in the 94-95 area.
**************************************************************
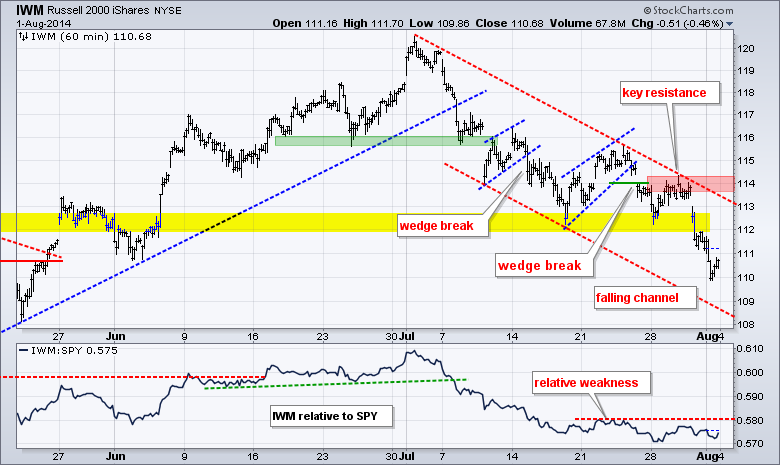
IWM gapped down last week and moved towards the lower trend line of the falling channel. This is the first target for a decline. The upper trend line of the falling channel marks first support. Last week's highs and a small buffer mark key support in the 114 area. The price relative (IWM:SPY ratio) firmed over the last two weeks, but remains in a downtrend as IWM continues to underperform SPY.
**************************************************************
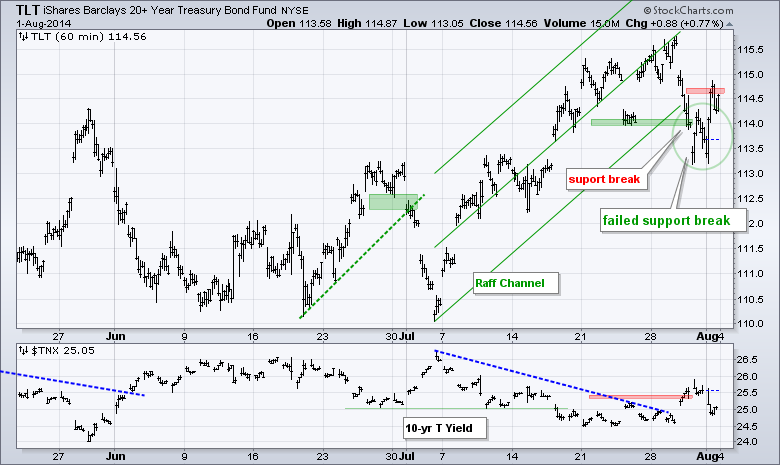
TLT surged on Friday as both long-term and short-term rates fell. This means the support break has failed and TLT is back on the upswing. Long-term Treasuries are still a very difficult play right now. The economy shows strength and the labor markets are improving, but Fed buying seems to be winning the war. Probably best not to fight the Fed because their pockets are deeper than ours.
**************************************************************
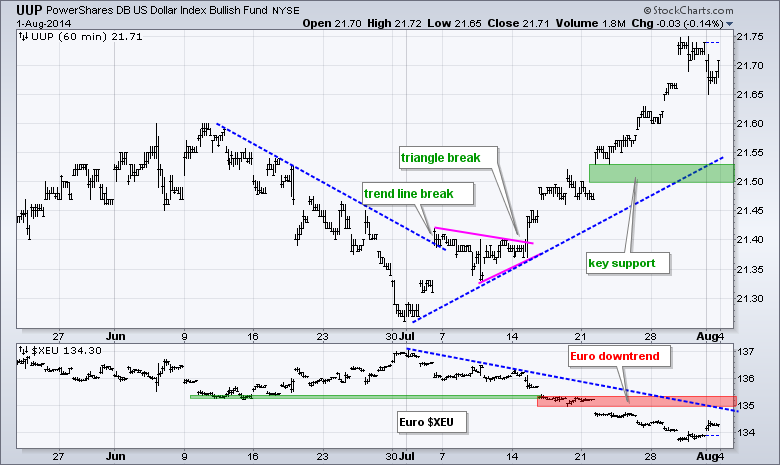
UUP remains in a strong uptrend and $XEU remains in a strong downtrend. The moves may be getting extended, but pullbacks would be viewed as corrections within the uptrend. Key support for UUP is set at 21.50 and key resistance for $XEU is set at 135.50.
**************************************************************
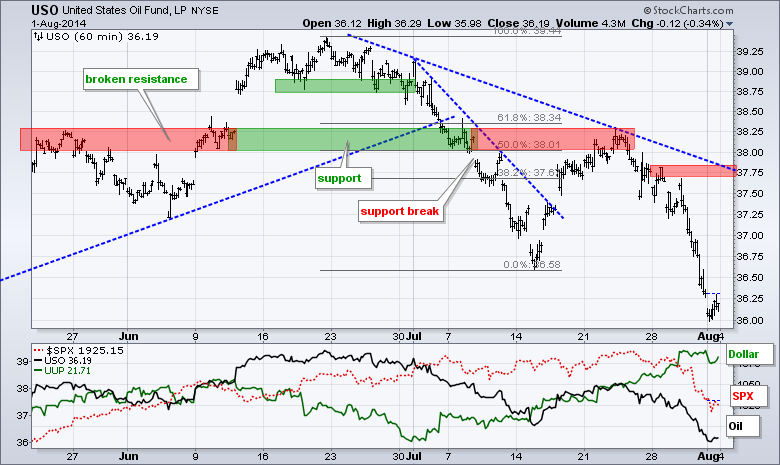
A strong Dollar, weak stock market and fracking fever weighed on oil as USO plunged below its mid July low. The ETF is getting a little oversold after the sharp decline, but the trend is clearly down here. I will keep resistance in the 37.75 area for now.
**************************************************************
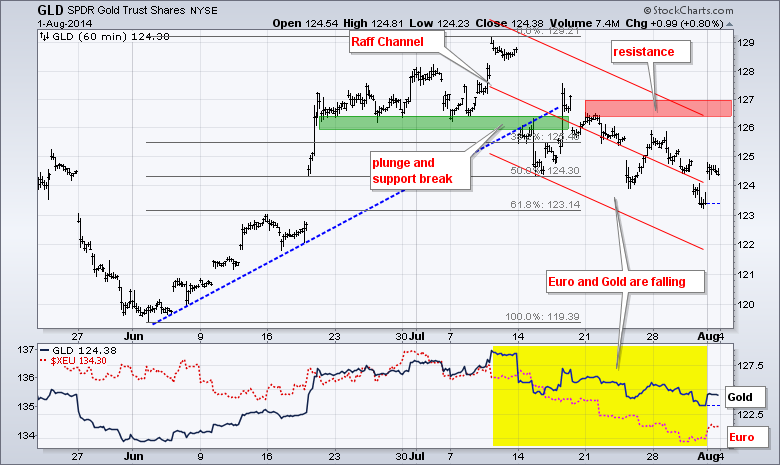
GLD got a bounce on Friday, but this bounce is still within a short-term downtrend. The three week decline could be corrective because GLD bounced off the 62% retracement, but there was no follow thru to Friday's bounce and no breakout. The Raff Regression Channel, late July highs and a buffer mark resistance at 127. Watch this level for the follow through breakout.
***************************************************************
Key Reports and Events (all times Eastern):
Tue - Aug 05 - 10:00 - ISM Non-Manufacturing Index
Tue - Aug 05 - 10:00 - Factory Orders
Wed - Aug 06 - 07:00 - MBA Mortgage Index
Wed - Aug 06 - 10:30 - Crude Oil Inventories
Thu - Aug 07 - 08:30 - Initial Jobless Claims
Fri - Aug 08 - 08:00 - ChartCon
This commentary and charts-of-interest are designed to stimulate thinking. This analysis is not a recommendation to buy, sell, hold or sell short any security (stock ETF or otherwise). We all need to think for ourselves when it comes to trading our own accounts. First, it is the only way to really learn. Second, we are the only ones responsible for our decisions. Think of these charts as food for further analysis. Before making a trade, it is important to have a plan. Plan the trade and trade the plan. Among other things, this includes setting a trigger level, a target area and a stop-loss level. It is also important to plan for three possible price movements: advance, decline or sideways. Have a plan for all three scenarios BEFORE making the trade. Consider possible holding times. And finally, look at overall market conditions and sector/industry performance.
