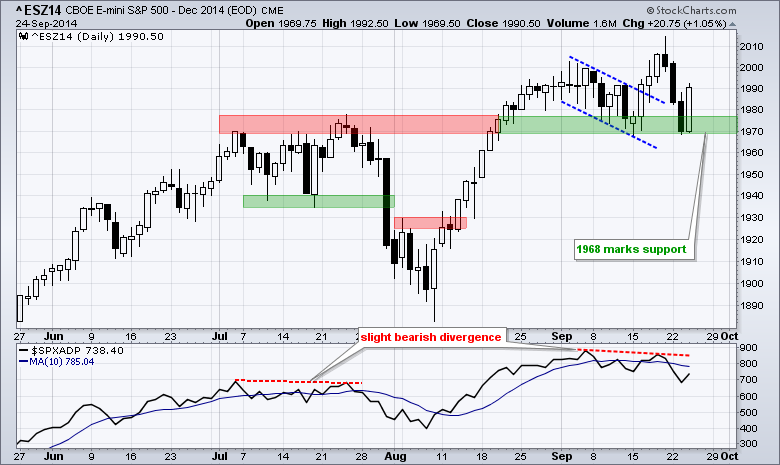
Stocks got an oversold bounce on Wednesday with QQQ leading the way (+1.07%). The bounces were relatively modest, but QQQ and SPY managed to hold some important short-term support levels. Materials, healthcare and consumer discretionary led the sector SPDRs higher. The consumer discretionary got a big boost from the Retail SPDR, which surged over 1.5%. Biotechs led the healthcare sector higher as the Biotech SPDR (XBI) surged over 3%. I will stick with the emini chart for another day because it shows a pretty good bounce off the support zone. This move affirms support in the 1970 area and a break below 1968 would be short-term bearish. The S&P 500 AD Line remains in a short-term downtrend with a lower high last week and a lower low this week. At the very least, a move above the 10-day SMA is needed to turn breadth positive again.
**This chart analysis is for educational purposes only, and should not
be construed as a recommendation to buy, sell or sell-short said securities**
**************************************************************
SPY got a bounce off the mid September lows and surged above 199. Notice that the ETF first moved above 199 in late August and crossed this level a dozen times since then. Trading since late August has been flat and this looks like one big consolidation. Trading within a consolidation is tricky and relative weakness in small-caps is a negative.

**************************************************************
QQQ held above the mid September low and surged above 99.5 to keep the flag breakout alive. QQQ is clearly the strongest of the three right now (IWM, SPY, QQQ), This bounce reinforces support in the 98.5-99 area, a break of which would be bearish. Apple continues to fiddle with the upper trend line of the triangle. The bendable iphone and ios 8 glitch could curtail buying pressure and prevent a breakout. Watch support at 100 for a short-term support break.
http://stockcharts.com/h-sc/ui?s=QQQ&p=60&yr=0&mn=2&dy=15&id=p23705557677&a=283139705
**************************************************************
IWM started working its way lower the first two weeks of September and then plunged over the last four trading days. The ETF may have become short-term oversold, but the downtrend and relative weakness still dominate. I will mark a minor resistance zone at 112.5, a break of which could trigger a bigger oversold bounce. I will leave major resistance at 115.6 for now.

**************************************************************
The 20+ YR T-Bond ETF (TLT) surged to broken support and resistance in the 115.5 area and turned back. Also notice that the 5-year Treasury Yield ($FVX) and the 10-YR Treasury Yield ($TNX) turned up in their support zones. I will remain bearish on TLT as long as the two yields hold their support zones. Break downs in these yields would be bearish for Treasury prices, which move in the opposite direction.

**************************************************************
No change. UUP consolidated in mid September and then broke out (twice). The consolidation lows mark first support in the 22.30-22.40 area. While a move below this level would break support, I would not turn bearish because the bigger trend is still up - and the Euro is in a strong downtrend. Key support for UUP remains at 21.9 for now.

**************************************************************
The USO Oil Fund (USO) found support in the 34 area with two bounces this month and surged to the channel trend line. Oil is definitely oversold and ripe for a bounce, but relentless strength in the Dollar could limit a bounce. Key resistance is set at 35.50. A breakout here would reverse the short-term downtrend.

**************************************************************
No change. Gold is a classic case of becoming oversold and remaining oversold. With the recent highs around 119-119.5, I will move minor resistance to this area. A breakout here could give way to an oversold bounce. Chartists should also watch the Dollar because gold is clearly tied to the Dollar. Broken support and the early September high mark major resistance in the 122-123 area.

***************************************************************
Key Reports and Events (all times Eastern):
Thu - Sep 25 - 08:30 - Initial Jobless Claims
Thu - Sep 25 - 08:30 - Durable Goods Orders
Thu - Sep 25 - 10:30 - Natural Gas Inventories
Fri - Sep 26 - 08:30 - GDP
Fri - Sep 26 - 09:55 - Michigan Sentiment
Chart Setups on Tuesday and Thursday.


This commentary and charts-of-interest are designed to stimulate thinking. This analysis is not a recommendation to buy, sell, hold or sell short any security (stock ETF or otherwise). We all need to think for ourselves when it comes to trading our own accounts. First, it is the only way to really learn. Second, we are the only ones responsible for our decisions. Think of these charts as food for further analysis. Before making a trade, it is important to have a plan. Plan the trade and trade the plan. Among other things, this includes setting a trigger level, a target area and a stop-loss level. It is also important to plan for three possible price movements: advance, decline or sideways. Have a plan for all three scenarios BEFORE making the trade. Consider possible holding times. And finally, look at overall market conditions and sector/industry performance.
