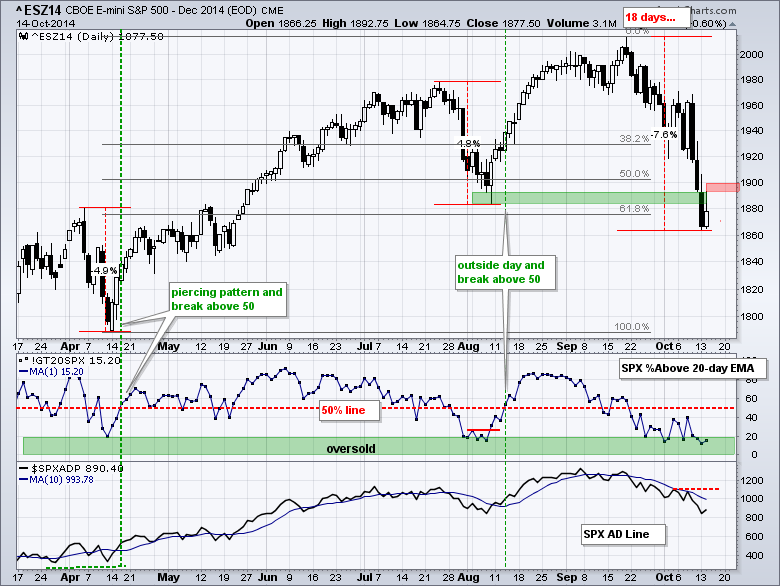
Stocks attempted to bounce in early trading, but selling pressure took hold and the major index ETFs fell back in the afternoon. The S&P 500 SPDR (SPY) finished with a small gain (.54%) and the S&P 100 ETF (OEF) ended with a small loss (.09%). Small-caps and micro-caps held up relatively well as IWM and IWC gained over 1% on the day. Relative strength in these two is only two days old, but something I will continue to watch. Elsewhere, Treasuries extended their run and the 10-YR Treasury Yield fell to the 2.2% area. Oil extended its fall with a move into the low 80s. Risk remains a four-letter word as the markets prefer the safety of bonds. The chart below shows the e-mini firming for a day and I am marking bear trap resistance at 1900. A close above this level would be short-term positive. I would also look for confirmation with a breakout in the S&P 500 Percent Above 20-day EMA (!GT20SPX).
**This chart analysis is for educational purposes only, and should not
be construed as a recommendation to buy, sell or sell-short said securities**
**************************************************************
SPY broke support from the early October lows and moved below 188 to extend the downtrend. Broken support turns first resistance in the 192.4-193 area. The ETF remains oversold and this could give way to a bounce or a consolidation of sorts. The indicator window shows SPY underperforming TLT, which means money prefers safety over risk right now.

**************************************************************
QQQ is also oversold and in a short-term downtrend. Oversold conditions could give way to a bounce or consolidation, but I would not look for a trend reversal just yet. Broken support in the 96-96.5 area turns into first resistance. The indicator window shows Apple with a possible descending triangle. A break below support would be short-term bearish and weight on QQQ.

**************************************************************
IWM remains within a falling channel and clear downtrend. The ETF, however, did show some relative strength on Monday-Tuesday. With all the international fears (Ebola, Europe, strong Dollar), homegrown small-caps may offer an alternative. The channel trend line and this week's high mark resistance at 107.50.

**************************************************************
The 20+ YR T-Bond ETF (TLT) continues its steep ascent with yet another new high. This uptrend is about as extended as the downtrend in stocks. Such strength in Treasuries reflects risk aversion in the market and this is not good for stocks or commodities. Key support is set at 118.50.

**************************************************************
No change. The US Dollar ETF (UUP) pulled back last week, but found support in the 22.6-22.7 area and bounced on Thursday-Friday. This reaction low affirms support and keeps the uptrend alive. Even though a break would be short-term negative, I would still view any weakness as a pullback within a bigger uptrend. The indicator window shows the Euro Index ($XEU) hitting resistance in the 127.5 area.

**************************************************************
The USO Oil Fund (USO) is in a free fall as the ETF fell some 14% in the last three weeks. Oil is more oversold than stocks and remains in a strong downtrend. There will be a violent bounce one day, but playing that bounce is a challenge. The October trend line and recent peak mark first resistance at 32.50.

**************************************************************
The Gold SPDR (GLD) is at an interesting juncture: resistance in a long-term downtrend. Even though the ETF sprung a bear trap with the surge back above 117, the advance still looks like a counter trend move because a rising flag formed. A move below the lower trend line and support at 117 would reverse the rising flag and signal a continuation of the long-term downtrend.

***************************************************************
Key Reports and Events (all times Eastern):
Wed - Oct 15 - 07:00 - MBA Mortgage Index
Wed - Oct 15 - 08:30 - Retail Sales
Wed - Oct 15 - 08:30 - Producer Price Index (PPI)
Wed - Oct 15 - 08:30 - Empire State Manufacturing
Wed - Oct 15 - 14:00 - Fed's Beige Book
Thu - Oct 16 - 08:30 - Initial Jobless Claims
Thu - Oct 16 - 09:15 - Industrial Production
Thu - Oct 16 - 10:00 - Philadelphia Fed
Thu - Oct 16 - 10:00 - NAHB Housing Market Index
Thu - Oct 16 - 10:30 - Natural Gas Inventories
Thu - Oct 16 - 11:00 - Crude Oil Inventories
Fri - Oct 17 - 08:30 - Housing Starts/Building Permits
Fri - Oct 17 - 09:55 - Michigan Sentiment
Chart Setups are on Tuesday and Thursday.
This commentary and charts-of-interest are designed to stimulate thinking. This analysis is not a recommendation to buy, sell, hold or sell short any security (stock ETF or otherwise). We all need to think for ourselves when it comes to trading our own accounts. First, it is the only way to really learn. Second, we are the only ones responsible for our decisions. Think of these charts as food for further analysis. Before making a trade, it is important to have a plan. Plan the trade and trade the plan. Among other things, this includes setting a trigger level, a target area and a stop-loss level. It is also important to plan for three possible price movements: advance, decline or sideways. Have a plan for all three scenarios BEFORE making the trade. Consider possible holding times. And finally, look at overall market conditions and sector/industry performance.
