Stocks got good news with the employment report last Friday and the bounce was rather tepid. Stocks got more good news with retail sales on Thursday, but failed to hold the bounce. The inability to rise in the face of good news is negative. Perhaps the stock market is starting to focus on the plunge in oil prices and the negative ramifications. While I think the positives outweigh the negatives, the decline was so sharp that there will clearly be some fall out in the coming weeks and months. Energy related junk bonds have plunged, banks with exposure to the energy sector will be affected and countries dependent on oil exports will have some serious budget short falls. These negatives are creating turmoil in the credit markets and could ultimately affect the stock market. The stock market, however, is its own beast and I prefer to watch the price charts and the breadth indicators for signals, not external indicators or issues. If selling pressure does hit, it will be reflected on these charts and we will get bearish signals. SPY, QQQ and IWM are close to support breaks, and the AD Lines are trading just above key supports. Another day or two of weakness would likely break these key levels and reverse the short-term uptrends.
**This chart analysis is for educational purposes only, and should not
be construed as a recommendation to buy, sell or sell-short said securities**
Short-term Overview (Friday, 12-December-2014):
- The AD Lines are in uptrends and I marked the key levels to watch for a break down.
- The three bond-related risk indicators are negative, but the two stock specific indicators are positive.
- SPY failed to hold its bounce and is testing key support in the 203-204 area again.
- QQQ is testing key support in the 103 area with a small pennant.
- IWM remains in a consolidation that is narrowing.
- TLT extended its uptrend and key support remains at 120.
- UUP fell back this week and the Euro bounced, but the Euro is nearing resistance.
- USO firmed early last week, but fell again to continue its strong downtrend.
- GLD surged for the third time in six weeks and formed a small bull flag this week.
The December E-mini S&P 500 (^ESZ14) surged above 2050 in early trading, but fell back to the 2030 area by the close. This amounts to a failed intraday rally and the ETF is once again testing support. A break below 2020 would be short-term bearish.
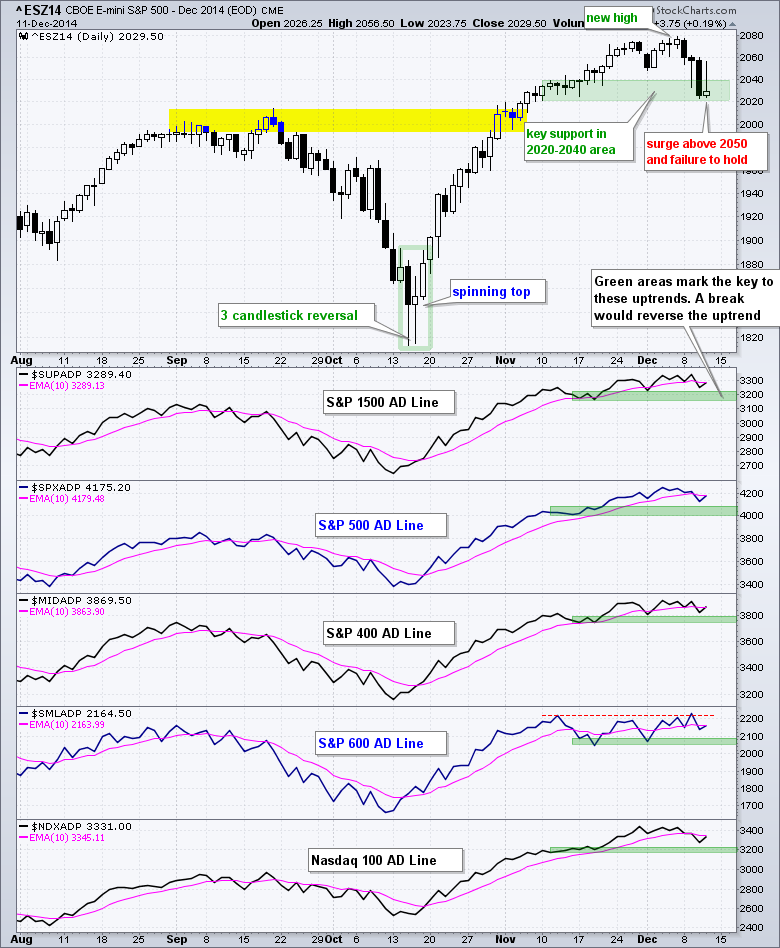
At what point would breadth turn bearish? That is the million-dollar question. I am trying to allow for a pullback and set a support level that, if broken, would suggest enough selling pressure to reverse the uptrends. Three of the five AD Lines are below their 10-day EMAs, but all five are above their green support zones. A move below these zones would reverse the uptrends and turn breadth bearish.
The three bond-related risk indicators remain negative because the credit markets are in turmoil right now. The sharp decline in oil is a shock to the system because countries and companies dependent on oil revenues are suddenly at risk. Investors are demanding higher interest rates for more risk and this has caused the yield on junk bonds to rise, and the price to fall. Money is moving into Treasuries as a safe haven and because inflation expectations are very low right now.

SPY has a series of lower lows and lower highs working this week. I am hesitant to call a four day decline a short-term downtrend, but the bounces have clearly failed this week and selling pressure is picking up. Flag resistance is set at 206 and a move above this level is needed to end the small pullback. At this point, I would like to allow for a pullback within an uptrend, but will cry uncle on a break below Wednesday's low.

**************************************************************
QQQ broke the November trend line and then consolidated with a pennant formation. A move below 103 would break pennant support and signal a continuation of the early December decline (106 to 103). This would also suggest a break of the support zone and reversal of the short-term uptrend. Apple remains in a December downtrend that is defined by a falling flag.

**************************************************************
IWM remains range bound, but this range has narrowed a little in December. Talk about indecisive. What happens within the range is anyone's guess. A move above 119 would break range resistance, while a move below 114 would break range support. IWM is still outperforming in December, but this is mainly due to weakness in SPY.

**************************************************************
No change. Oil is down over 20% in the last few weeks and the 20+ YR T-Bond ETF (TLT) is up over 3%. Weakness in oil is helping Treasury bonds in two ways. First, money is moving out of energy related junk bonds and finding its way into safer assets. Second, the fall in oil is disinflationary and this is positive for Treasury bonds. Key support remains at 120.

**************************************************************
No change. The US Dollar ETF (UUP) fell back this week and the Euro Index ($XEU) bounced, but the overall trends remain the same. The Euro is nearing resistance in the 124.5-125 area and the bounce could reverse soon. UUP remains above its support zone in the 23.20 area and in a clear uptrend.

**************************************************************
No change. The USO Oil Fund (USO) tried to firm, but selling pressure hit again and the ETF hit another new low on Friday. The oversold simply remain oversold and this is testament to the strength of the downtrend. Key resistance remains in the 29 area for now.

**************************************************************
The Gold SPDR (GLD) has been trending higher since early November and there are three big surges within this uptrend. The ETF formed a falling flag like pattern after the last surge from 114 to 119 and a break above 118.5 would signal another continuation higher. The early December low marks channel support in the 114-114.5 area.

***************************************************************
Key Reports and Events (all times Eastern):
Fri - Dec 12 - 08:30 - Producer Price Index (PPI)
Fri - Dec 12 - 09:55 - Michigan Sentiment
Charts of Interest are on Tuesdays and Thursdays.
This commentary and charts-of-interest are designed to stimulate thinking. This analysis is not a recommendation to buy, sell, hold or sell short any security (stock ETF or otherwise). We all need to think for ourselves when it comes to trading our own accounts. First, it is the only way to really learn. Second, we are the only ones responsible for our decisions. Think of these charts as food for further analysis. Before making a trade, it is important to have a plan. Plan the trade and trade the plan. Among other things, this includes setting a trigger level, a target area and a stop-loss level. It is also important to plan for three possible price movements: advance, decline or sideways. Have a plan for all three scenarios BEFORE making the trade. Consider possible holding times. And finally, look at overall market conditions and sector/industry performance.
