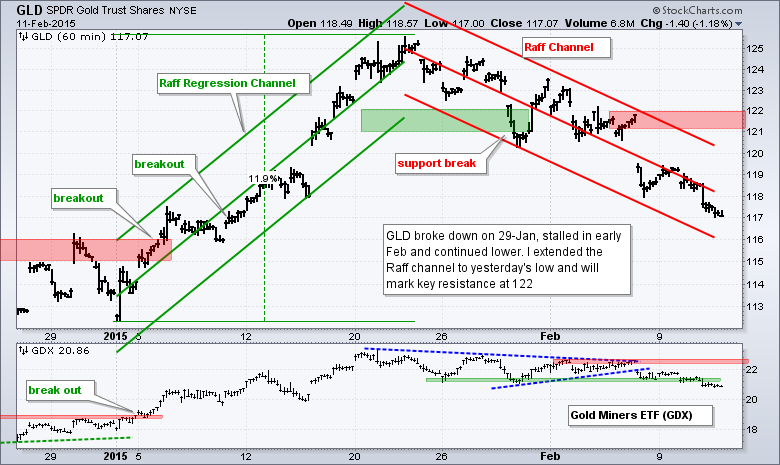
It was a choppy day on Wall Street with QQQ edging higher and IWM edging lower. The sectors were mixed with techs and consumer staples producing small gains. Utilities took another hit as the Utilities SPDR (XLU) fell over 2%. Within the tech sector, the Networking iShares (IGN), Semiconductor SPDR (XSD) and Internet ETF (FDN) ended with small gains. Gold fell and this weighed on the Gold Miners ETF (GDX) and the Silver Miners ETF (SIL). GDX broke below its late January low and shows relative weakness in February.
**This chart analysis is for educational purposes only, and should not
be construed as a recommendation to buy, sell or sell-short said securities**
Short-term Overview (Thursday, 12-February-2015):
- Short-term breadth turned bullish on 21-Jan and remains bullish.
- All five risk indicators are positive.
- SPY, QQQ and IWM remain in short-term uptrends, but IWM is lagging.
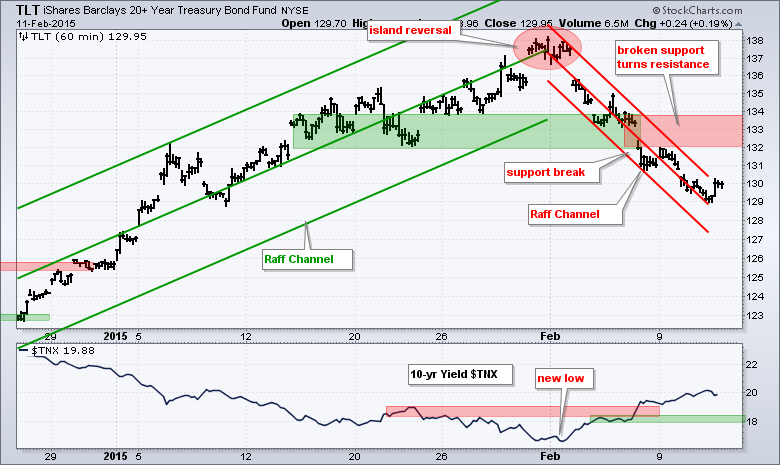
- TLT extended its short-term downtrend and is getting oversold.
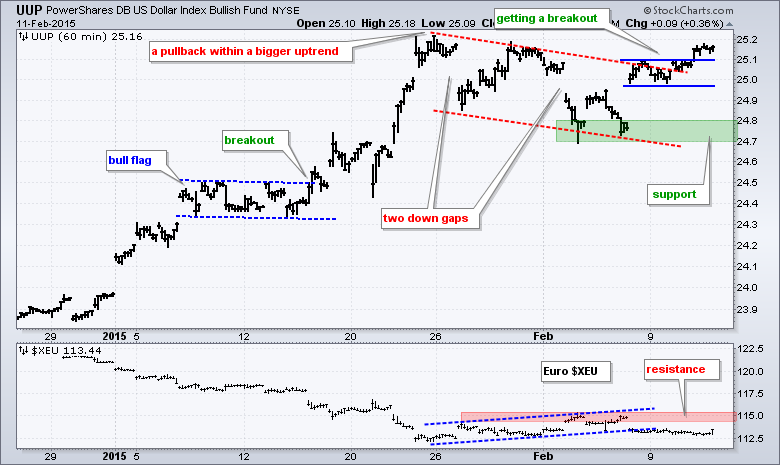
- UUP pulled back for two weeks and broke above the channel trend line this week.
- USO is choppy and untradeable.
- GLD broke down on 29-Jan and extended its downtrend this week.
The E-mini did a little afternoon dip, but rallied into the close and closed at its highest level of 2015. This close also keeps the E-mini above the mid January highs and keeps the bigger triangle breakout alive.
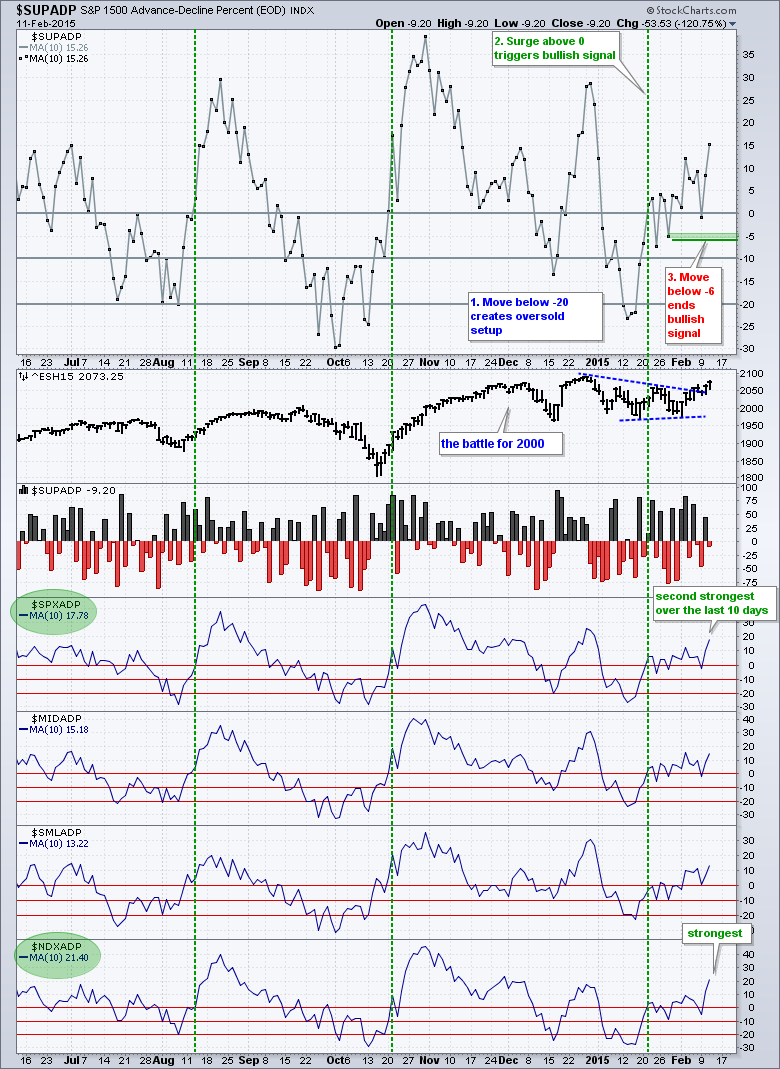
Broad market breadth remains bullish and is not even close to overbought. Even though AD Percent was negative on Wednesday, the 10-day SMA for S&P 1500 AD Percent ($SUPADP) surged above +15% on Wednesday. This is because the 10-day SMA dropped a big negative day (11 days ago) and added a smaller negative day (Wednesday). The net result was less negative (positive) and this caused the 10-day SMA to rise. I will stay bullish on this indicator as long as it holds above -6%. Note that Nasdaq 100 AD Percent ($NDXADP) and S&P 500 AD Percent ($SPXADP) are the strongest of the four individual AD Percent indicators.
All five risk indicators remain positive for stocks, but February has not been a good month for small-caps and the equal-weight S&P 500. Even though the Equal-Weight S&P 500 ETF (RSP) is lagging the S&P 500 SPDR (SPY) since last week, the trend since mid January is still up and I have yet to see a break down that would turn this risk indicator negative. Elsewhere, stocks are outperforming Treasuries (SPY:IEF), the 5-year Treasury Yield ($FVX) is rising and junk bonds are outperforming investment grade bonds.

The short-term evidence remains bullish and large-caps are leading. This may explain why upside breadth is not that strong. Breadth, however, is still more bullish than bearish right now. Keep in mind that large-caps dominate the S&P 500 and Nasdaq 100. Strength in large-caps, therefore, is positive for these two indices, and their related ETFs. Elsewhere, the Dollar is breaking out, gold continued lower and oil remains choppy.

**************************************************************

**************************************************************

**************************************************************
**************************************************************
**************************************************************

**************************************************************
***************************************************************
Key Reports and Events (all times Eastern):
Thu - Feb 12 - 08:30 - Initial Jobless Claims
Thu - Feb 12 - 08:30 - Retail Sales
Thu - Feb 12 - 10:30 - Natural Gas Inventories
Fri - Feb 13 - 09:55 - Michigan Sentiment
Tue - Feb 17 - 08:30 - Empire Manufacturing
Tue - Feb 17 - 10:00 - NAHB Housing Market Index
Wed - Feb 18 - 07:00 - MBA Mortgage Index
Wed - Feb 18 - 08:30 - Housing Starts/Building Permits
Wed - Feb 18 - 08:30 - Producer Price Index (PPI)
Wed - Feb 18 - 09:15 - Industrial Production
Wed - Feb 18 - 14:00 - FOMC Minutes
Thu - Feb 19 - 08:30 - Initial Jobless Claims
Thu - Feb 19 - 10:00 - Philadelphia Fed
Thu - Feb 19 - 10:00 - Leading Indicators
Thu - Feb 19 - 10:30 - Natural Gas Inventories
Thu - Feb 19 - 11:00 - Oil Inventories
Mon - Feb 23 - 10:00 - Existing Home Sales
Tue - Feb 24 - 09:00 - Case-Shiller 20-city Index
Tue - Feb 24 - 10:00 - Consumer Confidence
Wed - Feb 25 - 07:00 - MBA Mortgage Index
Wed - Feb 25 - 10:00 - New Home Sales
Wed - Feb 25 - 10:30 - Oil Inventories
Thu - Feb 26 - 08:30 - Initial Jobless Claims
Thu - Feb 26 - 08:30 - Consumer Price Index (CPI)
Thu - Feb 26 - 08:30 - Durable Goods Orders
Thu - Feb 26 - 09:00 - FHFA Housing Price Index
Thu - Feb 26 - 10:30 - Natural Gas Inventories
Fri - Feb 27 - 08:30 - GDP
Fri - Feb 27 - 09:45 - Chicago PMI
Fri - Feb 27 - 09:55 - Michigan Sentiment
Fri - Feb 27 - 10:00 - Pending Home Sales
This commentary is designed to stimulate thinking. This analysis is not a recommendation to buy, sell, hold or sell short any security (stock ETF or otherwise). We all need to think for ourselves when it comes to trading our own accounts. First, it is the only way to really learn. Second, we are the only ones responsible for our decisions. Think of these charts as food for further analysis. Before making a trade, it is important to have a plan. Plan the trade and trade the plan. Among other things, this includes setting a trigger level, a target area and a stop-loss level. It is also important to plan for three possible price movements: advance, decline or sideways. Have a plan for all three scenarios BEFORE making the trade. Consider possible holding times. And finally, look at overall market conditions and sector/industry performance.
