It was pop and drop on Monday, and then drop and pop on Tuesday. Welcome to the week featuring the Fed policy statement on Wednesday and the employment report on Friday. Trading could remain choppy the next few days as these events become reality. Stocks were mostly higher on Tuesday with small-caps leading the way. The gains, however, were modest as IWM advanced .55% and SPY added just .32%. The consumer discretionary sector lagged as XLY closed lower and the Retail SPDR (XRT) fell .37%. The Internet ETF (FDN) and Social Media Global ETF (SOCL) were hit with a huge decline in Twitter (-18). Banks attracted some buying interest as the 10-YR Treasury Yield ($TNX) edged higher ahead of the Fed statement. The Regional Bank SPDR (KRE) and Broker-Dealer iShares (IAI) both gained over 1%.
**This chart analysis is for educational purposes only, and should not
be construed as a recommendation to buy, sell or sell-short said securities**
Short-term Overview (Wednessday, 29-April-2015):
- Short-term breadth indicators remain bullish.
- The sectors are mixed with two in uptrends, two flat and one in a downtrend.
- SPY and QQQ hit new highs Monday and remain in short-term uptrends.
- IWM did not confirm the new high in SPY and is testing support already.
- TLT broke consolidation support to reverse its uptrend last week.
- UUP broke below the triangle trend line last week and remains in a short-term downtrend.
- USO is stalling, but remains in a short-term uptrend.
- GLD surged off a key retracement zone and broke out with a follow thru advance on Tuesday.
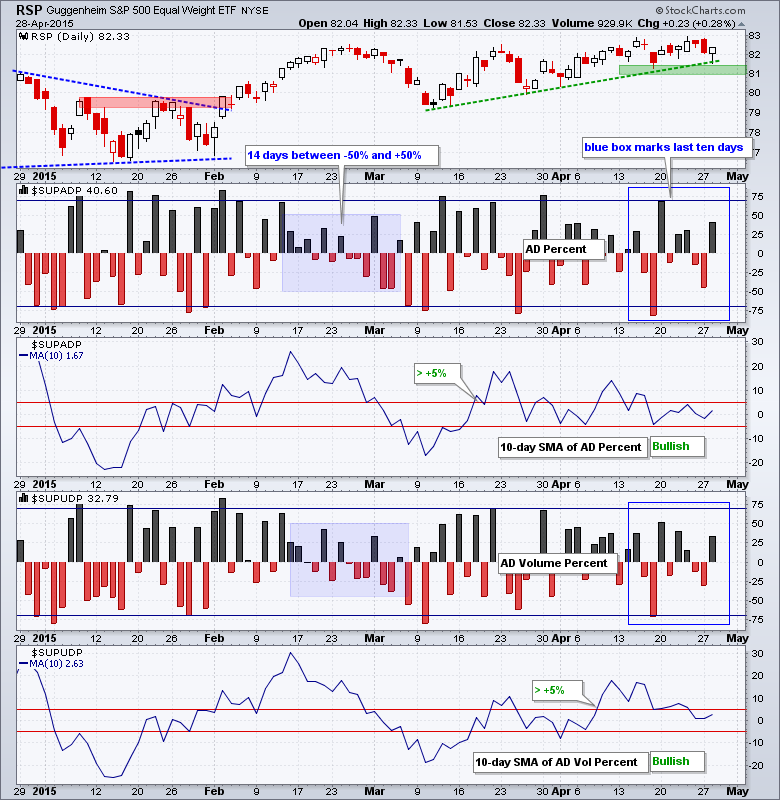
The Equal-Weight S&P 500 ETF (RSP) bounced with a small gain to affirm support in the 81-81.5 area. A break below 81 would reverse this short-term uptrend. AD Percent and AD Volume Percent finished modestly positive, but still below +50% as buying pressure was not that strong. Selling pressure is not strong and buying pressure is not strong, but buying pressure has a slight edge because the 10-day SMAs remain in bull mode.
The equal-weight sectors are mixed. The Equal-Weight Consumer Discretionary ETF (RCD) and Equal-weight Finance ETF (RYF) bounced off support zones, but the bounce looks fragile and breakdowns in these two would be bearish. The Equal-weight Technology ETF (RYT) and Equal-weight Industrials ETF (RGI) are in uptrends with higher highs and higher lows this month. The Equal-weight Healthcare ETF (RYH) broke down on Monday and is the only one in a downtrend.

**************************************************************

**************************************************************

**************************************************************

**************************************************************

**************************************************************

**************************************************************

**************************************************************

***************************************************************
Key Reports and Events (all times Eastern):
Tue - Apr 28 - 10:00 - Consumer Confidence
Wed - Apr 29 - 07:00 - MBA Mortgage Purchase Index
Wed - Apr 29 - 10:00 - Pending Home Sales
Wed - Apr 29 - 10:30 - Oil Inventories
Wed - Apr 29 - 14:00 - FOMC Rate Decision
Thu - Apr 30 - 08:30 - Initial Jobless Claims
Thu - Apr 30 - 08:30 - PCE Prices
Thu - Apr 30 - 08:30 - Personal Income & Personal Spending
Thu - Apr 30 - 09:45 - Chicago PMI
Thu - Apr 30 - 10:30 - Natural Gas Inventories
Fri - May 01 - 08:15 - ADP Employment Report
Fri - May 01 - 10:00 - Construction Spending
Fri - May 01 - 10:00 - ISM Manufacturing Index
Fri - May 01 - 10:00 - Michigan Sentiment
Fri - May 01 - 17:00 - Auto-Truck Sales
This commentary is designed to stimulate thinking. This analysis is not a recommendation to buy, sell, hold or sell short any security (stock ETF or otherwise). We all need to think for ourselves when it comes to trading our own accounts. First, it is the only way to really learn. Second, we are the only ones responsible for our decisions. Think of these charts as food for further analysis. Before making a trade, it is important to have a plan. Plan the trade and trade the plan. Among other things, this includes setting a trigger level, a target area and a stop-loss level. It is also important to plan for three possible price movements: advance, decline or sideways. Have a plan for all three scenarios BEFORE making the trade. Consider possible holding times. And finally, look at overall market conditions and sector/industry performance.
