Stocks surged on Monday and recovered most of Friday's losses. The S&P 500 moved back above 2100 in the first hour (+1%) and then consolidated the rest of the day. The consumer discretionary, technology, industrials and utilities sectors led with 1+ percent gains. Internet, software, semiconductor and networking stocks lifted the tech sector. The Dow Transports also surged over 1.5% with strength coming from airlines, truckers and rails. Commodities were hit hard with 1+ percent losses coming in the Silver ETF (SLV), Aluminum ETN (JJU), Copper ETN (JJC) and Base Metals ETF (DBB).
**This chart analysis is for educational purposes only, and should not
be construed as a recommendation to buy, sell or sell-short said securities**
Short-term Overview (Tuesday, 21-April-2015):
- Breadth recovered on Monday and the short-term indicators remain bullish.
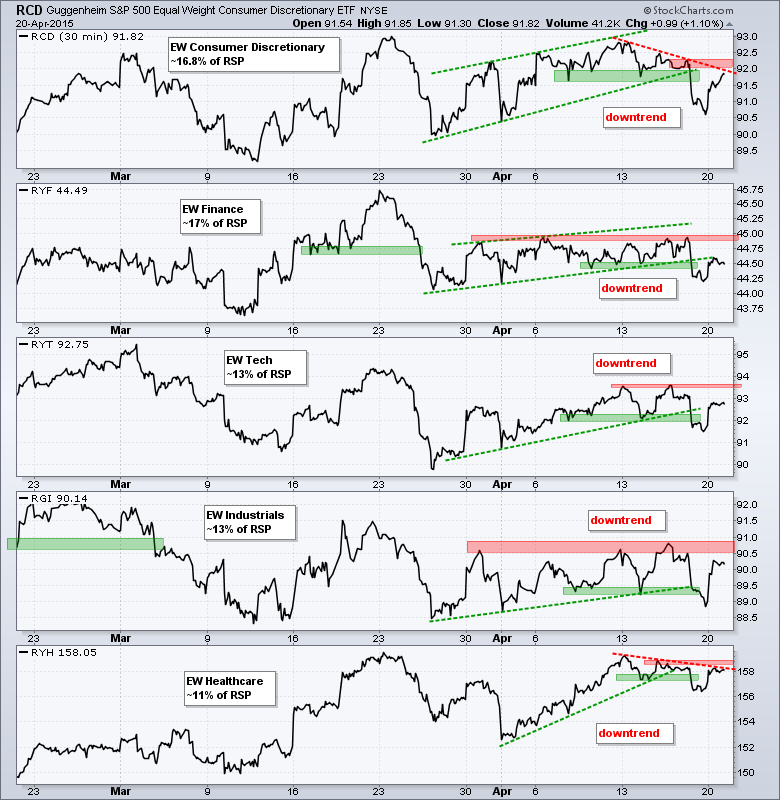
- All five big sectors are in short-term downtrends.
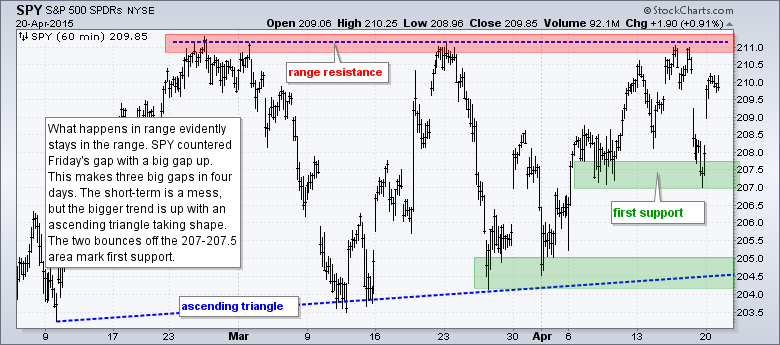
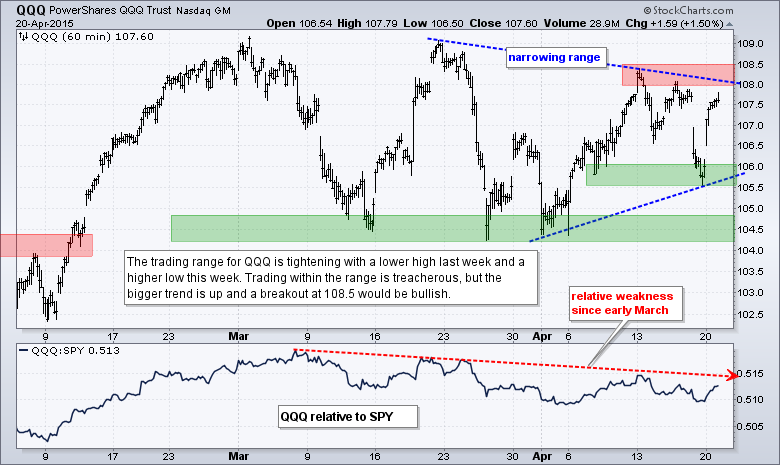
- SPY and QQQ gapped up and surged, but remain within larger trading ranges.
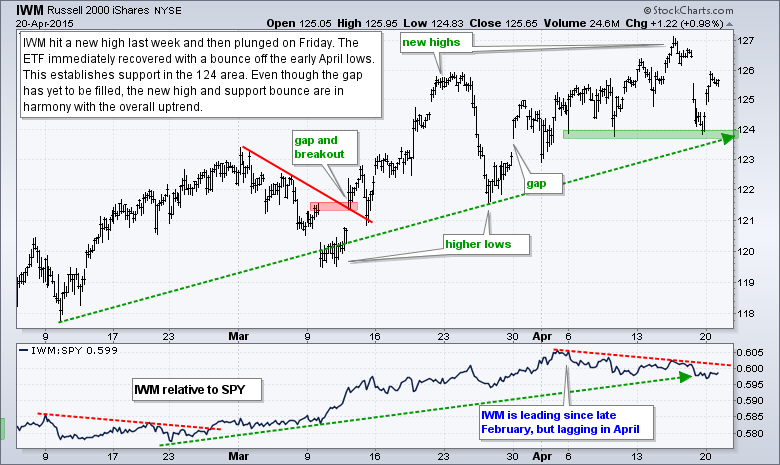
- IWM surged off the April lows and remains in an uptrend overall.
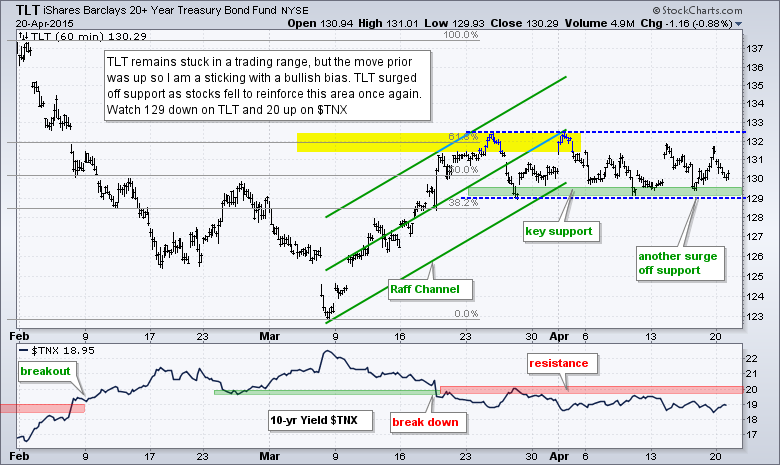
- TLT is back near consolidation support, which holds the key to the uptrend.
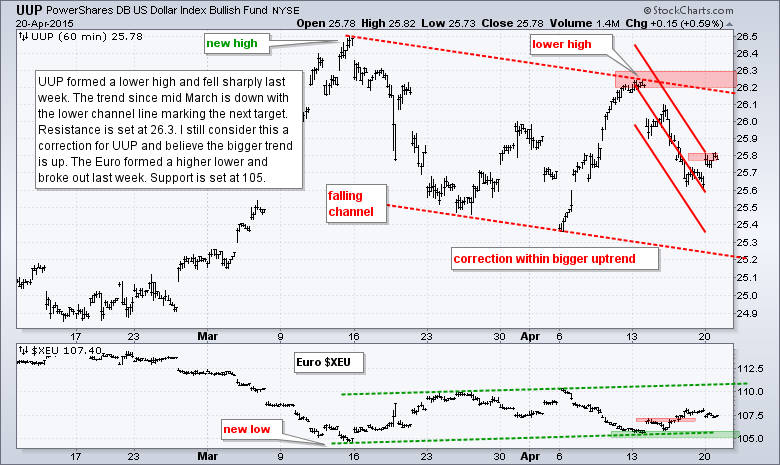
- UUP is in a short-term downtrend after a sharp decline last week.
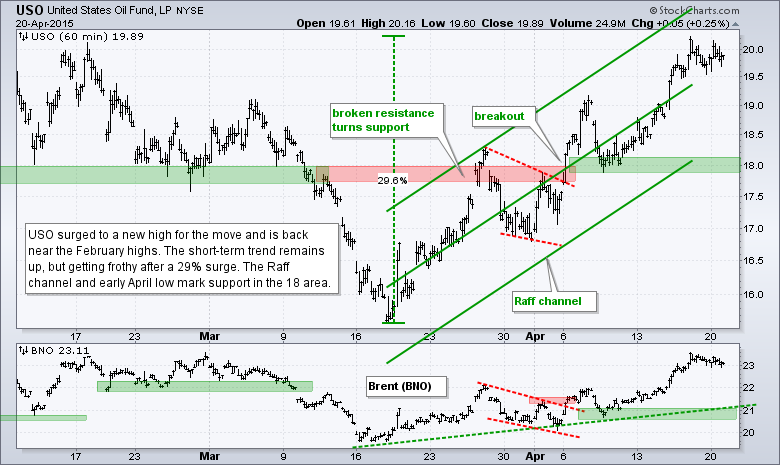
- USO remains in a short-term uptrend, but very overbought.
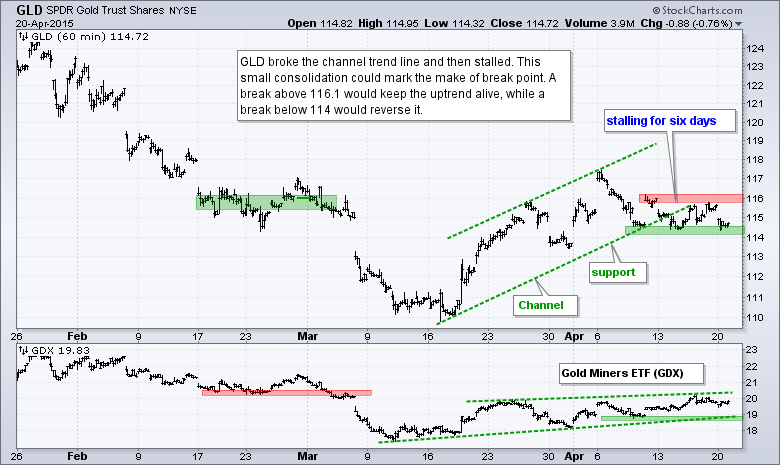
- GLD extended its consolidation and could be at a make-or-break point.
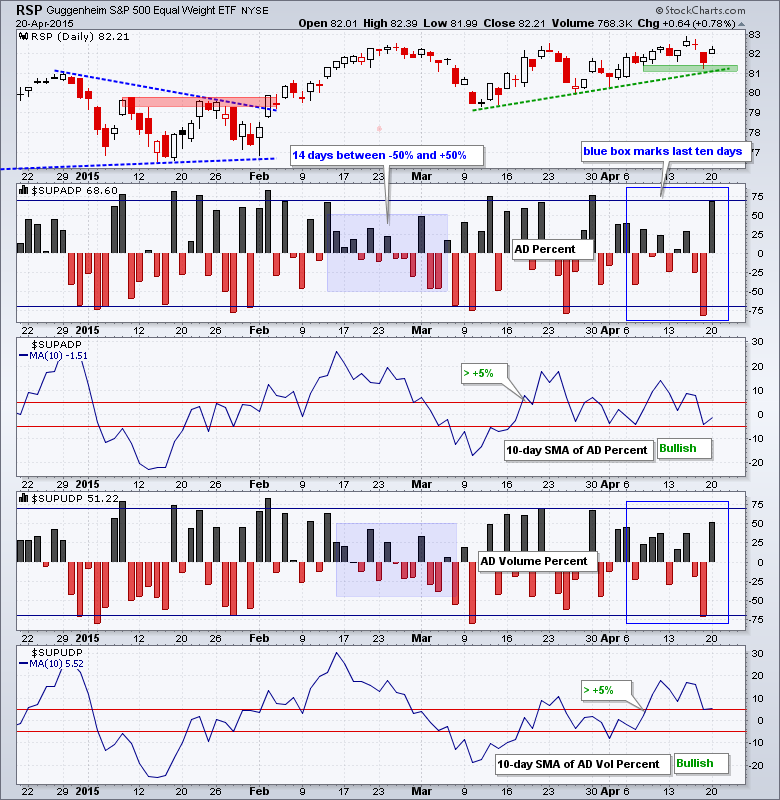
The Equal-Weight S&P 500 ETF (RSP) bounced off support to keep the uptrend alive, and affirm support at 81. AD Percent and AD Volume Percent surged above 50%. The positive surges, however, did not exceed Friday's negative plunges. The 10-day SMA for AD Percent is in negative territory, but has yet to break below -5% for a bearish signal. The 10-day SMA for AD Volume Percent is above +5% and holding up better. This means large-cap breadth is stronger than small-cap breadth.
All five equal-weight sector ETFs surged and recovered a good portion of Friday's decline, but all five remain in short-term downtrends. It is a tough call because the support breaks did not hold very long and the steepness of the recovery is quite positive. The Equal-weight Technology ETF (RYT), Equal-weight Industrials ETF (RGI) and Equal-weight Healthcare ETF (RYH) are back above their support breaks and showing the most potential for upside breakouts.
**************************************************************
**************************************************************
**************************************************************
**************************************************************
**************************************************************
**************************************************************
**************************************************************
***************************************************************
Key Reports and Events (all times Eastern):
Wed - Apr 22 - 07:00 - MBA Mortgage Index
Wed - Apr 22 - 09:00 - FHFA Housing Price Index
Wed - Apr 22 - 10:00 - Existing Home Sales
Wed - Apr 22 - 10:30 - Oil Inventories
Thu - Apr 23 - 08:30 - Initial Jobless Claims
Thu - Apr 23 - 10:00 - New Home Sales
Thu - Apr 23 - 10:30 - Natural Gas Inventories
Fri - Apr 24 - 08:30 - Durable Goods Orders
Tue - Apr 28 - 09:00 - Case-Shiller Housing Index
Tue - Apr 28 - 10:00 - Consumer Confidence
Wed - Apr 29 - 07:00 - MBA Mortgage Purchase Index
Wed - Apr 29 - 10:00 - Pending Home Sales
Wed - Apr 29 - 10:30 - Oil Inventories
Wed - Apr 29 - 14:00 - FOMC Rate Decision
Thu - Apr 30 - 08:30 - Initial Jobless Claims
Thu - Apr 30 - 08:30 - PCE Prices
Thu - Apr 30 - 08:30 - Personal Income & Personal Spending
Thu - Apr 30 - 09:45 - Chicago PMI
Thu - Apr 30 - 10:30 - Natural Gas Inventories
Fri - May 01 - 08:15 - ADP Employment Report
Fri - May 01 - 10:00 - Construction Spending
Fri - May 01 - 10:00 - ISM Manufacturing Index
Fri - May 01 - 10:00 - Michigan Sentiment
Fri - May 01 - 17:00 - Auto-Truck Sales
This commentary is designed to stimulate thinking. This analysis is not a recommendation to buy, sell, hold or sell short any security (stock ETF or otherwise). We all need to think for ourselves when it comes to trading our own accounts. First, it is the only way to really learn. Second, we are the only ones responsible for our decisions. Think of these charts as food for further analysis. Before making a trade, it is important to have a plan. Plan the trade and trade the plan. Among other things, this includes setting a trigger level, a target area and a stop-loss level. It is also important to plan for three possible price movements: advance, decline or sideways. Have a plan for all three scenarios BEFORE making the trade. Consider possible holding times. And finally, look at overall market conditions and sector/industry performance.
