Note that I will be doing a webinar today at 1PM ET (Tuesday, April 7th). I will cover market breadth, gold, oil, the dollar and some stock setups. Click here to register. Stocks shrugged off the miss in non-farm payrolls on Friday and surged in early trading on Monday. The S&P 500 dipped below 2058 on the open, but immediately reversed and surged to 2087 by lunch. Buying pressure dissipated in the afternoon and the index settled back in the 2080 area. The overall gain was modest (.66%) and breadth was not inspiring. The energy and utilities sectors led the bounce. Energy stocks were buoyed by a big surge in crude. It seems that 3-5% moves, both up and down, are the new normal for crude. Careful with this one because it is a real hot potato.
**This chart analysis is for educational purposes only, and should not
be construed as a recommendation to buy, sell or sell-short said securities**
Short-term Overview (Tuesday, 7-April-2015):
- Short-term breadth is mixed.
- Two of the five big sectors are in short-term uptrends.
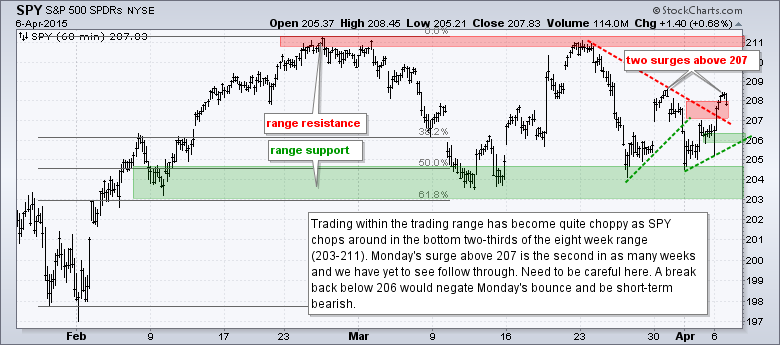
- SPY and QQQ surged off range support, but we have yet to see follow through.
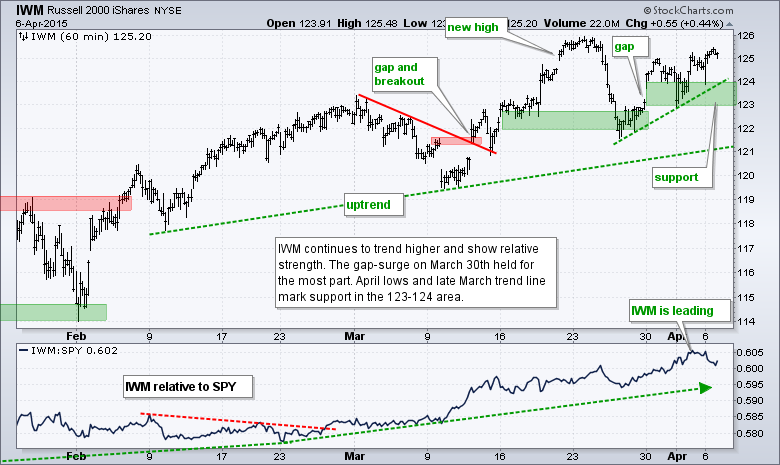
- IWM continues to hold up well by remaining in its uptrend and showing relative strength.
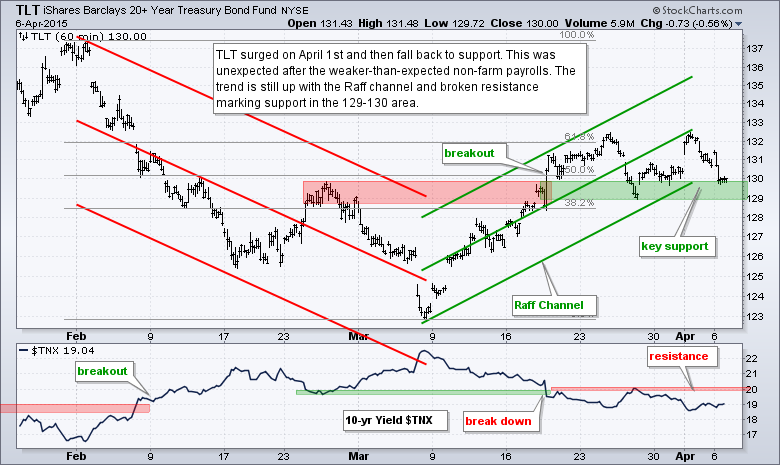
- TLT fell back to support over the last few days for an important test.
- UUP is in a short-term downtrend, but a long-term uptrend.
- USO broke wedge resistance with a surge on Monday.
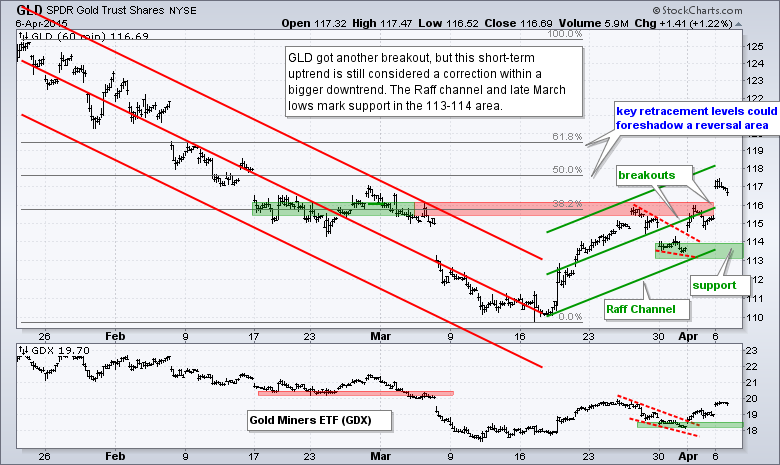
- GLD extended its short-term uptrend with a surge on Monday.
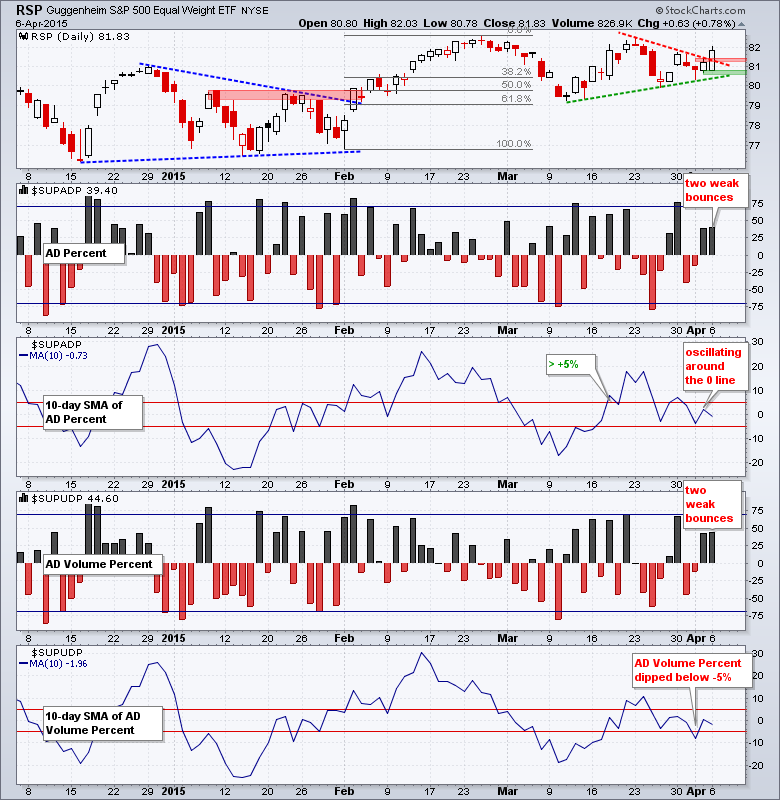
The Equal-Weight S&P 500 ETF (RSP) surged above the red resistance line to reverse its downswing. The green support line marks the next level to watch (call it 80.5). AD Percent and AD Volume Percent bounced the last two trading days, but these bounces were not that strong because neither exceeded +50%. The 10-day SMA of AD Percent is technically bullish because it exceeded +5% on March 18th and has yet to counter with a move below -5%. The 10-day SMA for AD Volume Percent did break below -5% to turn bearish on April 1st and remains bearish. Overall, the short-term breadth indicators are split and neutral.
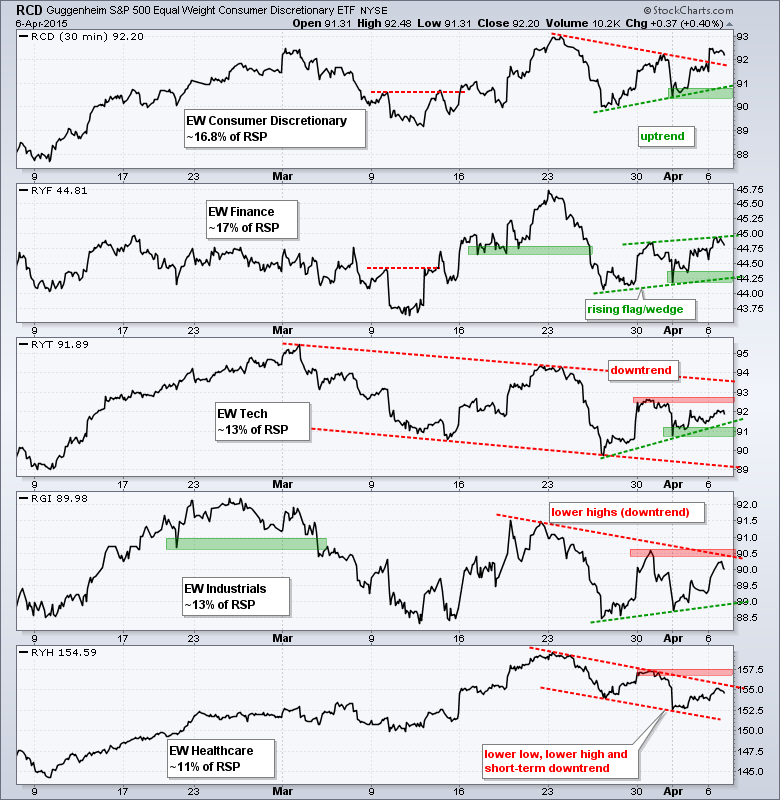
Two of the five equal-weight sectors are in uptrends, which means three of the five (majority) are in short-term downtrends. The Equal-Weight Consumer Discretionary ETF (RCD) is the leader with a triangle breakout on Monday. The Equal-weight Finance ETF (RYF) is also trending higher, but a rising flag/wedge may be taking shape so watch support at 44.25 for a breakdown. The Equal-weight Technology ETF (RYT) and Equal-weight Industrials ETF (RGI) bounced the last six days, but remain in downtrends over the last five weeks. The Equal-weight Healthcare ETF (RYH) shows relative weakness the last two week and a clear short-term downtrend. Watch resistance at 157.5 for a breakout.
The short-term evidence is mixed, very mixed. SPY and QQQ bounced off range support, but these bounces do not look that strong. IWM remains in a clear uptrend and shows relative strength. Breadth is mixed with AD Percent holding up better than AD Volume Percent. The sectors are mixed with two trending up and three trending down. All in all, I was not impressed with Monday's bounce and would like to see stronger breadth and better sector participation before turning short-term bullish on stocks overall.
**************************************************************

**************************************************************
**************************************************************
**************************************************************

**************************************************************

**************************************************************
***************************************************************
Key Reports and Events (all times Eastern):
Tue - Apr 07 - 10:00 - JOLTS
Wed - Apr 08 - 07:00 - MBA Mortgage Index
Wed - Apr 08 - 10:30 - Oil Inventories
Wed - Apr 08 - 14:00 - FOMC Minutes
Thu - Apr 09 - 08:30 - Initial Jobless Claims
Thu - Apr 09 - 10:30 - Natural Gas Inventories
Tue - Apr 14 - 08:30 - Retail Sales
Tue - Apr 14 - 08:30 - Producer Price Index (PPI)
Wed - Apr 15 - 07:00 - MBA Mortgage Index
Wed - Apr 15 - 08:30 - Empire State Manufacturing
Wed - Apr 15 - 09:15 - Industrial Production
Wed - Apr 15 - 10:00 - NAHB Housing Market Index
Wed - Apr 15 - 10:30 - Oil Inventories
Wed - Apr 15 - 14:00 - Fed's Beige Book
Thu - Apr 16 - 08:30 - Initial Jobless Claims
Thu - Apr 16 - 08:30 - Housing Starts & Building Permits
Thu - Apr 16 - 10:00 - Philadelphia Fed
Thu - Apr 16 - 10:30 - Natural Gas Inventories
Fri - Apr 17 - 08:30 - Consumer Price Index (CPI)
Fri - Apr 17 - 10:00 - Michigan Sentiment
Fri - Apr 17 - 10:00 - Leading Economic Indicators
Wed - Apr 22 - 07:00 - MBA Mortgage Index
Wed - Apr 22 - 09:00 - FHFA Housing Price Index
Wed - Apr 22 - 10:00 - Existing Home Sales
Wed - Apr 22 - 10:30 - Oil Inventories
Thu - Apr 23 - 08:30 - Initial Jobless Claims
Thu - Apr 23 - 10:00 - New Home Sales
Thu - Apr 23 - 10:30 - Natural Gas Inventories
Fri - Apr 24 - 08:30 - Durable Goods Orders
Tue - Apr 28 - 09:00 - Case-Shiller Housing Index
Tue - Apr 28 - 10:00 - Consumer Confidence
Wed - Apr 29 - 07:00 - MBA Mortgage Purchase Index
Wed - Apr 29 - 10:00 - Pending Home Sales
Wed - Apr 29 - 10:30 - Oil Inventories
Wed - Apr 29 - 14:00 - FOMC Rate Decision
Thu - Apr 30 - 08:30 - Initial Jobless Claims
Thu - Apr 30 - 08:30 - PCE Prices
Thu - Apr 30 - 08:30 - Personal Income & Personal Spending
Thu - Apr 30 - 09:45 - Chicago PMI
Thu - Apr 30 - 10:30 - Natural Gas Inventories
Fri - May 01 - 08:15 - ADP Employment Report
Fri - May 01 - 10:00 - Construction Spending
Fri - May 01 - 10:00 - ISM Manufacturing Index
Fri - May 01 - 10:00 - Michigan Sentiment
Fri - May 01 - 17:00 - Auto-Truck Sales
This commentary is designed to stimulate thinking. This analysis is not a recommendation to buy, sell, hold or sell short any security (stock ETF or otherwise). We all need to think for ourselves when it comes to trading our own accounts. First, it is the only way to really learn. Second, we are the only ones responsible for our decisions. Think of these charts as food for further analysis. Before making a trade, it is important to have a plan. Plan the trade and trade the plan. Among other things, this includes setting a trigger level, a target area and a stop-loss level. It is also important to plan for three possible price movements: advance, decline or sideways. Have a plan for all three scenarios BEFORE making the trade. Consider possible holding times. And finally, look at overall market conditions and sector/industry performance.
